Blog
This article is a contribution by Soichiro Ueda, who completed PFN’s internship program and now works part-time for the company.
Introduction
At Preferred Networks (hereafter PFN), we develop and operate machine learning infrastructure using Kubernetes. This article introduces our performance testing approach for the Kubernetes scheduler being developed at PFN.
PFN’s Kubernetes Scheduler
In Kubernetes, a scheduler is the component responsible for determining which Node within a cluster should run each Pod. Kubernetes’ scheduler employs a Scheduling Framework architecture, which enables each scheduler to implement its own custom logic through plugin mechanisms. Our PFN cluster has developed and deployed various such plugins.
One example of our custom plugins is one implementing Gang scheduling – a scheduling algorithm designed to ensure that multiple related Pods are scheduled simultaneously. For instance, in distributed training workloads, scheduling only a single Pod would cause the system to idle until all other Pods are also scheduled, unnecessarily tying up resources. With Gang scheduling, scheduling occurs only when all components required for distributed training are ready, allowing Pods to begin training immediately upon startup. This plugin is also released as open-source software. The GitHub repository can be found here: https://github.com/pfnet/scheduler-plugins
We have also developed a plugin specifically for GPU scheduling. For distributed training Pods, we implement scoring to schedule them on nodes where other Pods are also located as closely as possible, while for non-distributed training Pods, we schedule them on nodes where the requested number of GPUs matches the available GPU count to prevent GPU fragmentation. These logics were previously implemented using Lua scripts, but due to significant performance impacts, we recently reimplemented them in Go.
Benchmark Testing of the Scheduler in Kubernetes
The Kubernetes project includes a scheduler performance benchmark test called scheduler_perf. This test framework involves starting etcd, the API server, gand the scheduler, then applying various resources such as Nodes and Pods to measure metrics including the time taken for Pod scheduling. By running only control plane components without worker nodes, this setup enables simulation of large-scale cluster environments on a single machine.
The scheduler_perf framework allows defining benchmark scenarios using YAML configuration files. Here’s an example configuration:
- name: SchedulingBasic
  defaultPodTemplatePath: ../templates/pod-default.yaml # Path to the base Pod manifest
  workloadTemplate: # Configuration for the test scenario
  - opcode: createNodes # First step: add worker nodes
    countParam: $initNodes
  - opcode: createPods # Second step: add initial Pods
    countParam: $initPods
  - opcode: createPods # Third step: add additional Pods and measure scheduler metrics
    countParam: $measurePods
    collectMetrics: true
  workloads:
  - name: 500Nodes # Scenario parameters (number of Pods and Nodes)
    labels: [performance, short]
    params:
      initNodes: 500
      initPods: 500
      measurePods: 1000
This configuration first prepares a cluster with 500 Nodes and Pods, then measures scheduler metrics while adding 1000 additional Pods.
The test results output is generated in JSON format, as shown below:
    {
      "data": {
        "Average": 213.95953420343739,
        "Perc50": 55.986911435831445,
        "Perc90": 371.93215697104336,
        "Perc95": 371.93215697104336,
        "Perc99": 371.93215697104336
      },
      "unit": "pods/s",
      "labels": {
        "Metric": "SchedulingThroughput",
        "Name": "BenchmarkPerfScheduling/SchedulingBasic/500Nodes/namespace-2",
        "event": "not applicable",
        "extension_point": "not applicable",
        "plugin": "not applicable",
        "result": "not applicable"
      }
    },
This JSON object provides statistical data for the SchedulingThroughput metric, including average values and percentile measurements. Each scenario generates multiple such metrics. Other measurable metrics include execution times for various plugins.
In Kubernetes, scheduler_perf is executed as part of continuous integration, and its results are visualized using the Perfdash tool and displayed on perf-dash.k8s.io. As shown in Figure 1, the interface displays historical performance trends for scheduler_perf results. Additionally, each scenario has predefined threshold values for metrics; if any results fall below these thresholds, the CI build will fail.
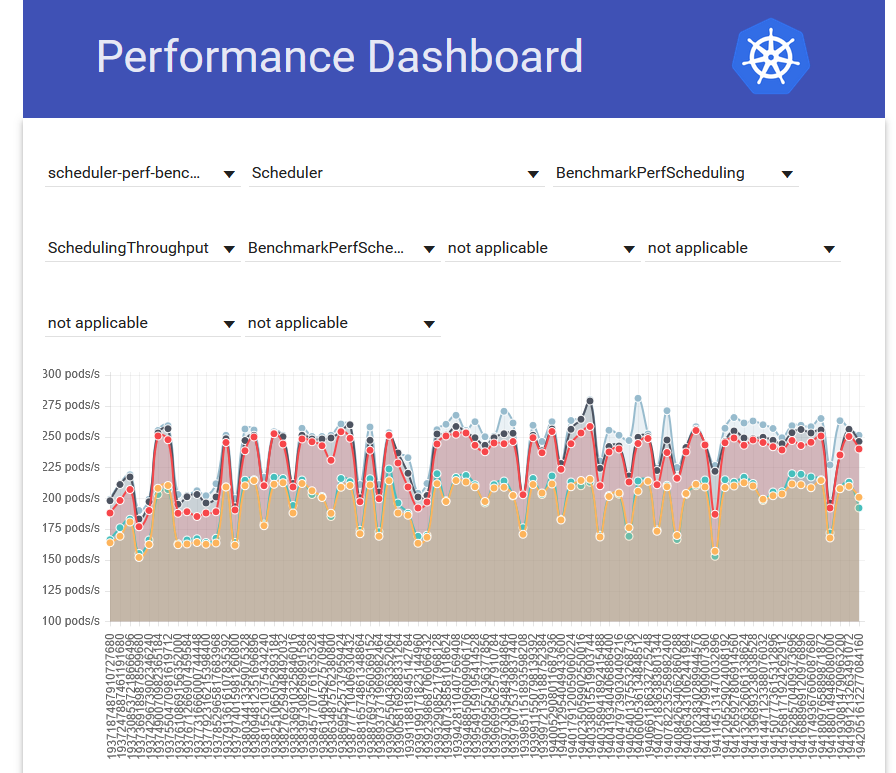
Figure 1: Visualization of scheduler_perf results using Perfdas
The integration of these benchmarks into the CI pipeline stems from the importance of scheduler performance. scheduler_perf serves to prevent critical performance degradation from functional enhancements to the scheduler while ensuring it maintains throughput above predefined thresholds.
scheduler_perf Usage at PFN
Given PFN’s extensive modifications to its scheduler, we needed to verify how these changes affected performance. Consequently, PFN’s scheduler also utilized scheduler_perf. However, we encountered two significant challenges with its implementation.
First, the maintenance overhead of scheduler_perf. Since scheduler_perf was implemented as Go test code, it wasn’t packaged separately. This meant executing scheduler_perf against PFN’s scheduler required copying the entire scheduler_perf codebase into PFN’s scheduler codebase. As a result, each time Kubernetes underwent version upgrades, we would need to manually integrate any changes made to scheduler_perf into PFN’s scheduler. This process became a burden during Kubernetes version upgrades.
Second, scheduler_perf wasn’t included in the CI pipeline and had to be run manually. This meant we couldn’t automatically monitor performance changes when making scheduler modifications. Instead, we would only discover performance degradation after completing releases, leading to a delayed response and making root cause analysis more difficult.
Below we describe recent initiatives we implemented to address these challenges.
Importing scheduler_perf
To accommodate PFN’s use case of running scheduler_perf against an enhanced scheduler, Kubernetes v1.30 introduced the ability to import scheduler_perf as a library. The relevant PR is here. PFN adopted this approach, switching from manual copying to proper library import. To execute scheduler_perf, you simply need to call the RunBenchmarkPerfScheduling function in your test code as follows:
import (
    "testing"
    perf "k8s.io/kubernetes/test/integration/scheduler_perf"
)


func BenchmarkPerfScheduling(b *testing.B) {
    perf.RunBenchmarkPerfScheduling(b, "/path/to/scheduler_perf_config.yaml", "", outOfTreeRegistry)
}
However, using this approach introduced one critical issue: the inability to add Custom Resource Definitions (CRDs) during scheduler_perf execution. PFN’s scheduler includes plugins that depend on CRDs. For instance, the kube-throttle plugin for Pod throttling introduces Throttle and ClusterThrottle CRDs and references them during scheduling. To run such plugins, the necessary CRDs must be installed. In the copy-based approach, we addressed this by applying patches to add CRDs to the cluster before execution. With the import method, however, the RunBenchmarkPerfScheduling function handles everything from starting the api-server and etcd to executing scheduler_perf, leaving no direct method to access the api-server for adding CRDs.
This problem isn’t unique to PFN – any user running scheduler_perf on an enhanced scheduler would face similar issues. We therefore provided feedback upstream about needing functionality to execute arbitrary operations on the api-server before scheduler_perf execution, and successfully merged a Pull Request. The relevant PR is scheduler-perf: add option to enable api-server initialization #131149.
This PR introduces the WithPrepareFn option, which allows setting a callback function to be executed before scheduler_perf runs. Within this callback function, you can access the api-server client, enabling you to add resources like CRDs as shown below:
    perf.RunBenchmarkPerfScheduling(b, "config/performance-config.yaml", "hogehoge", outOfTreeRegistry, perf.WithPrepareFn(func(tCtx ktesting.TContext) error {
        client := tCtx.APIExtensions()
        _, err := client.ApiextensionsV1().CustomResourceDefinitions().Create(tCtx,
            &apiextensionsv1.CustomResourceDefinition{
                // Custom Resource Definition
            },
            metav1.CreateOptions{})
        return err
    }))
This feature will be released in Kubernetes v1.34. While it hasn’t yet been usable with PFN’s scheduler, we’re currently mitigating the issue by excluding only plugins requiring CRDs.
Running scheduler_perf in Continuous Integration
The scheduler_perf scenarios provided by PFN require at least 10 minutes to complete each run. Consequently, continuously executing scheduler_perf every time a PR is merged could significantly hinder development speed. Therefore, we’ve implemented a system to run scheduler_perf exclusively just before release rather than during PR merging.
PFN’s Kubernetes scheduler release process follows this workflow:
- Manually trigger the GitHub Actions workflow_dispatch to create a release PR.
- Merge the generated release PR.
Consequently, we’ve configured scheduler_perf to execute simultaneously with the creation of the release PR.
For reporting scheduler_perf results, we’ve standardized the format by including them in the release PR’s description. This approach ensures automatic inclusion of scheduler_perf results in the release notes. Additionally, when documenting results, we’ve included comparative analysis with previous release metrics. The output displays performance data for each scenario, showing both current and previous results along with their differences. This enables pre-release performance trend analysis. Actual measurement results are presented in Tables 1 through 3. While other metrics are also measured, here we focus exclusively on SchedulingThroughput – a key metric indicating the number of scheduled pods per second.
| Metric | Previous Result | Current Result | Difference |
|---|---|---|---|
| SchedulingThroughput | 267.29 | 234.20 | -18.18% |
Table 1: Throughput of the standard, unmodified scheduler (pods/sec)
| Metric | Previous Result | Current Result | Difference |
|---|---|---|---|
| SchedulingThroughput | 31.66 | 26.51 | -16.28% |
Table 2: Throughput of PFN’s scheduler (pods/sec)
| Metric | Previous Result | Current Result | Difference |
|---|---|---|---|
| SchedulingThroughput | 4.08 | 3.38 | -17.33% |
Table 3: Throughput when scheduling Gang Pods using PFN’s scheduler
Note the significantly lower throughput in Table 3 for Gang Pod scheduling. This performance degradation occurs because this scenario involves Gang scheduling, which introduces additional overhead. Upon reviewing these results, we observed that PFN’s scheduler throughput was lower than expected. Further investigation revealed that while the production scheduler had replaced its Lua-based plugins with Go implementations, the scheduler being tested in scheduler_perf was still running Lua code. By replacing the Lua plugins with Go implementations, we achieved the following performance improvements, as demonstrated in Tables 4 and 5. These results clearly show that transitioning from Lua to Go significantly enhanced performance.
| Metric | Previous Result | Current Result | Difference |
|---|---|---|---|
| SchedulingThroughput | 26.51 | 374.08 | +1311.29% |
Table 4: Throughput when replacing Lua plugins with Go in PFN’s scheduler (pods/sec)
| Metric | Previous Result | Current Result | Difference |
|---|---|---|---|
| SchedulingThroughput | 4.08 | 19.59 | +479.91% |
Table 5: Throughput when replacing Lua plugins with Go for Gang Pod scheduling in PFN’s scheduler (pods/sec)
Conclusion
PFN has implemented extensions to Kubernetes’ scheduler and uses the scheduler_perf benchmark test from the upstream project to evaluate performance impacts. This article demonstrates how importing scheduler_perf as a package has enabled us to maintain it with minimal overhead. Furthermore, by automatically executing scheduler_perf before releases and displaying comparisons with previous releases, we can now verify performance impacts between releases before proceeding with deployment. We will continue to address challenges associated with developing Kubernetes scheduler extensions.
Area
Tag