Blog

Overview
To demonstrate the capability of Matlantis-PFP (hereafter referred to as PFP) version 9 on a public benchmark, we evaluate it using the PBE calculation mode on the well-known MLIP Arena benchmark, proposed by Chiang et al. [1]. MLIP Arena is an open benchmarking platform designed to assess machine-learning interatomic potentials beyond conventional static error metrics, such as energy and force prediction errors. Instead, it evaluates whether a model reproduces physically meaningful behavior in practical simulation settings, providing a complementary measure of model reliability for downstream atomistic simulations.
Following the MLIP Arena protocol, we compare model performance across five benchmark tasks: homonuclear diatomics (diatomics), equation of state (eos_bulk), energy-volume scans (wbm_ev), stability, and combustion. For detailed definitions of each task, please refer to the original MLIP Arena paper [1].
Table 1: Overall ranking
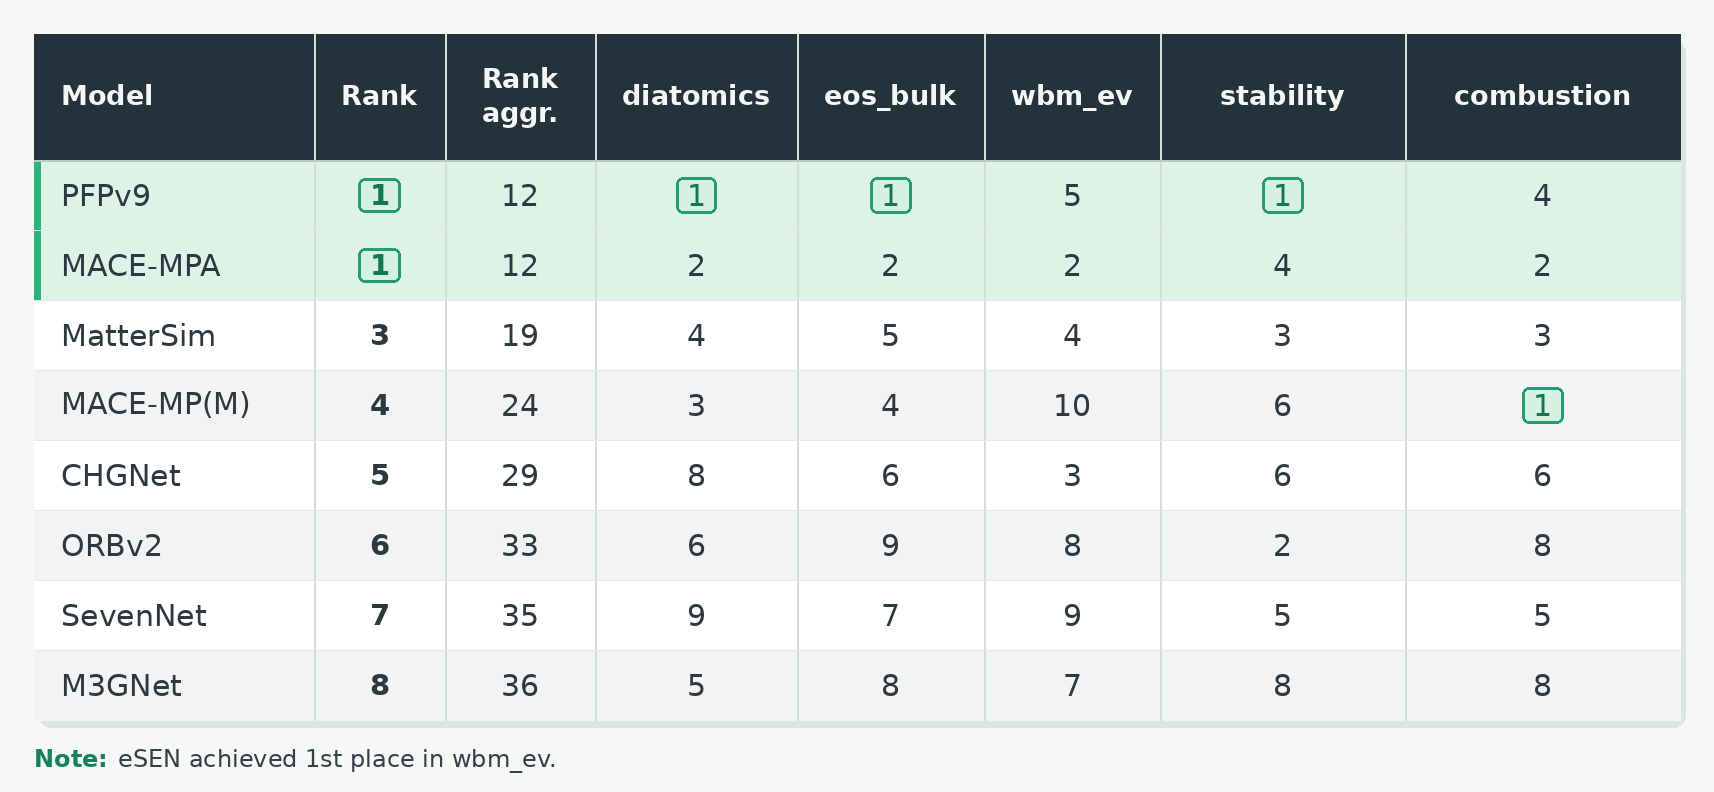
PFP v9 achieved a tied 1st-place result with MACE-MPA in the overall MLIP Arena ranking. The leaderboard values for models other than PFP v9.0.0 are based on the public MLIP Arena leaderboard as of March 1, 2026. This result places PFP v9 at the top of the arena, among the strongest models evaluated under the MLIP Arena protocol.
Table 2: Head-to-head comparison between PFP and MACE-MPA
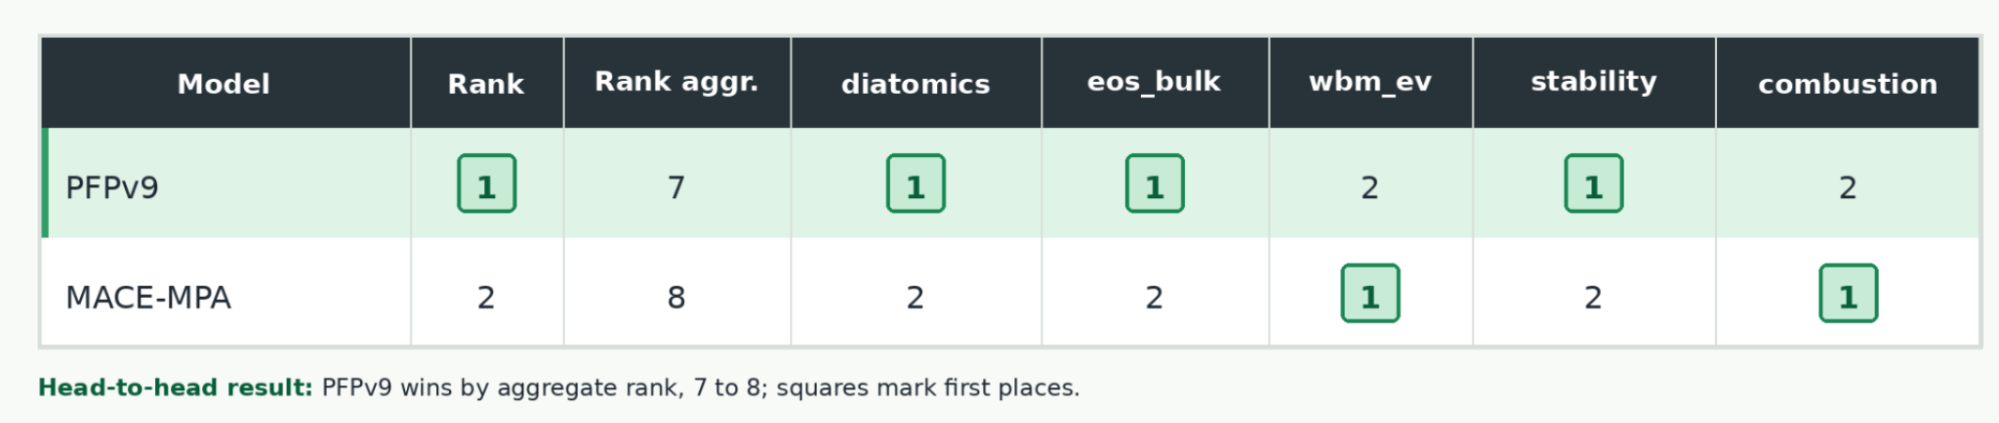
Since overall rankings may shift as new models enter the arena, we also examine head-to-head comparisons (i.e., pairwise comparisons between any two models). Notably, PFP v9 ranks first in three of the five tasks, guaranteeing it a majority victory in every pairwise comparison against any model in the arena, including MACE-MPA: an opponent can win at most the remaining two tasks. Consequently, no model in the arena can surpass PFP v9 in head-to-head evaluation.
Next, we discuss each benchmark result comparing PFP v9 and other models in the MLIP Arena benchmark.
Homonuclear diatomics: rank#1
Table 3: Homonuclear diatomics benchmark result.
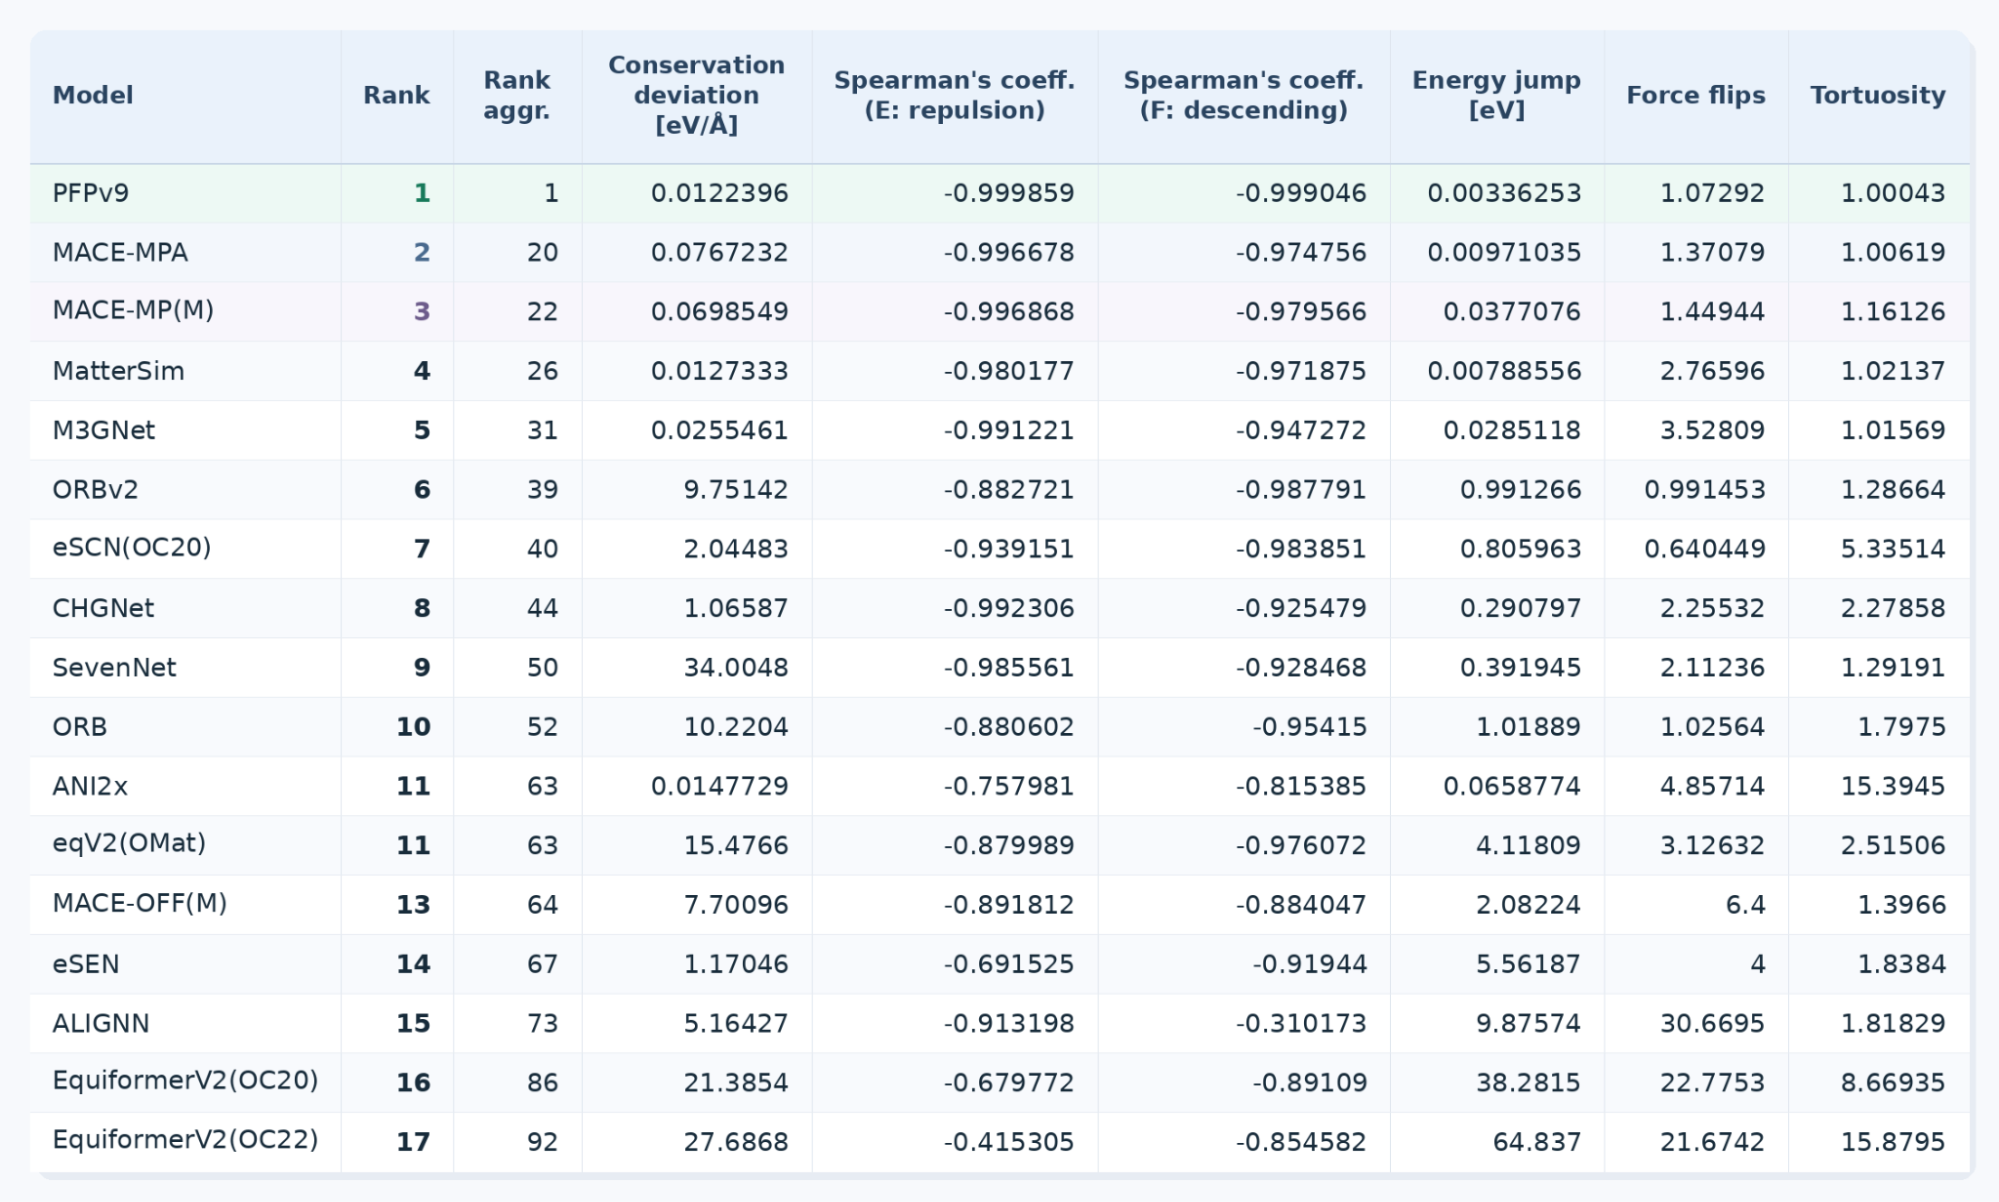
In the homonuclear diatomic task, a reliable model should produce smooth, stable, and physically ordered energy-force curves. PFPv9, which supports 96 elements, achieves the best performance across all evaluated metrics. It has the lowest conservation deviation, the smallest energy jump, near-ideal tortuosity, and the strongest Spearman correlations for both the repulsive-energy and descending-force trends. This indicates that PFPv9 does not rank first only by aggregate score; it consistently leads across the diagnostics used to assess whether the predicted diatomic curves are smooth, stable, and physically consistent.
Equation of state (eos_bulk): rank#1
Table 4: eos_bulk benchmark result
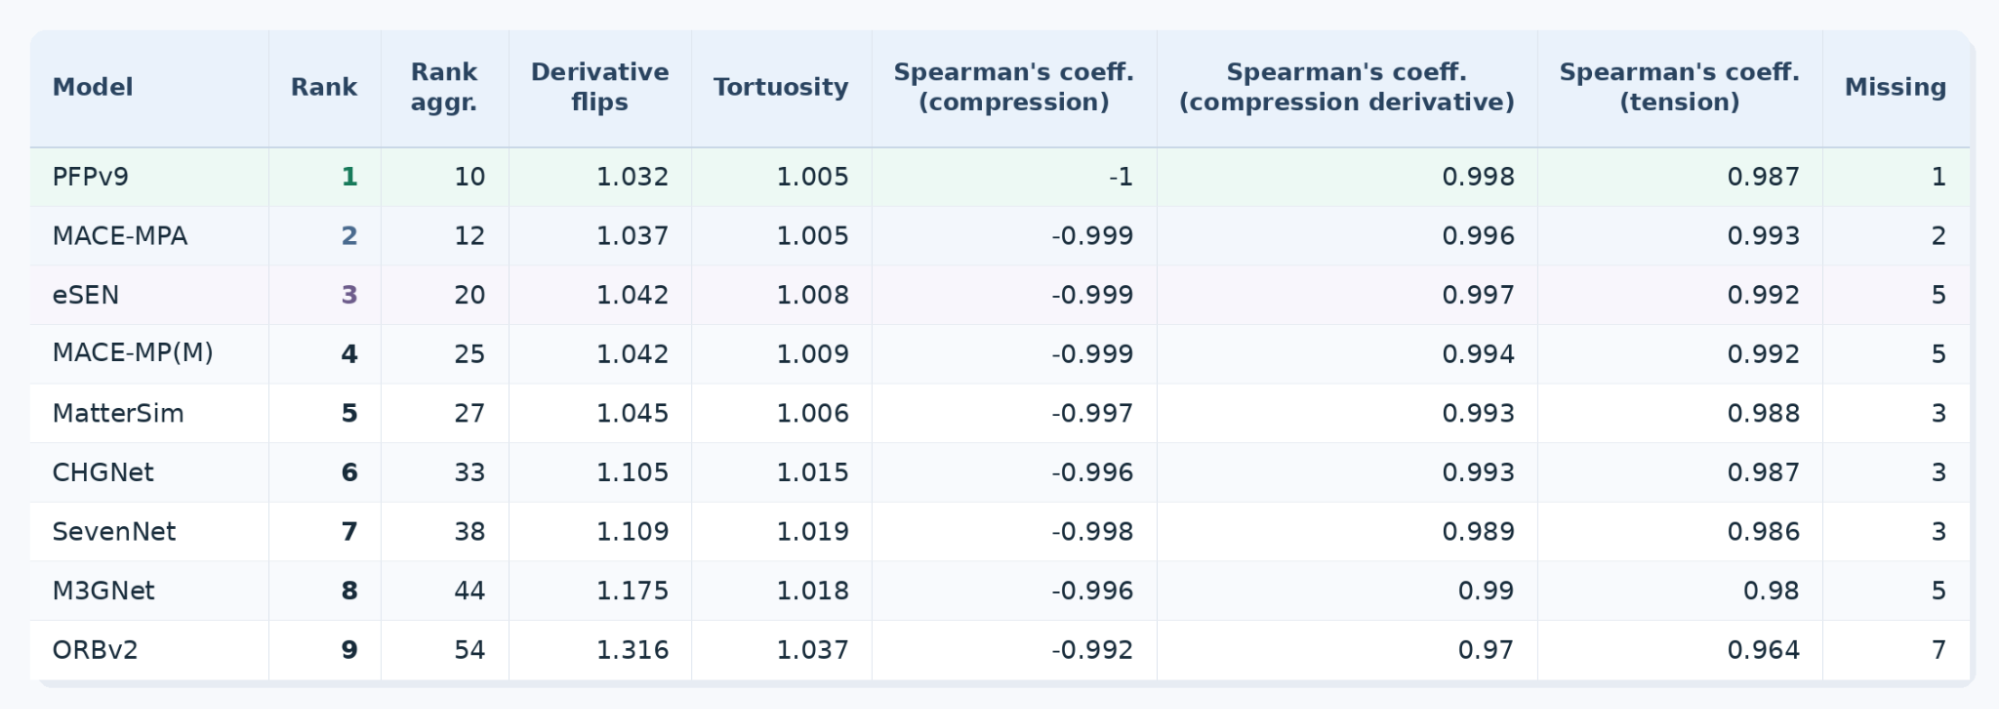
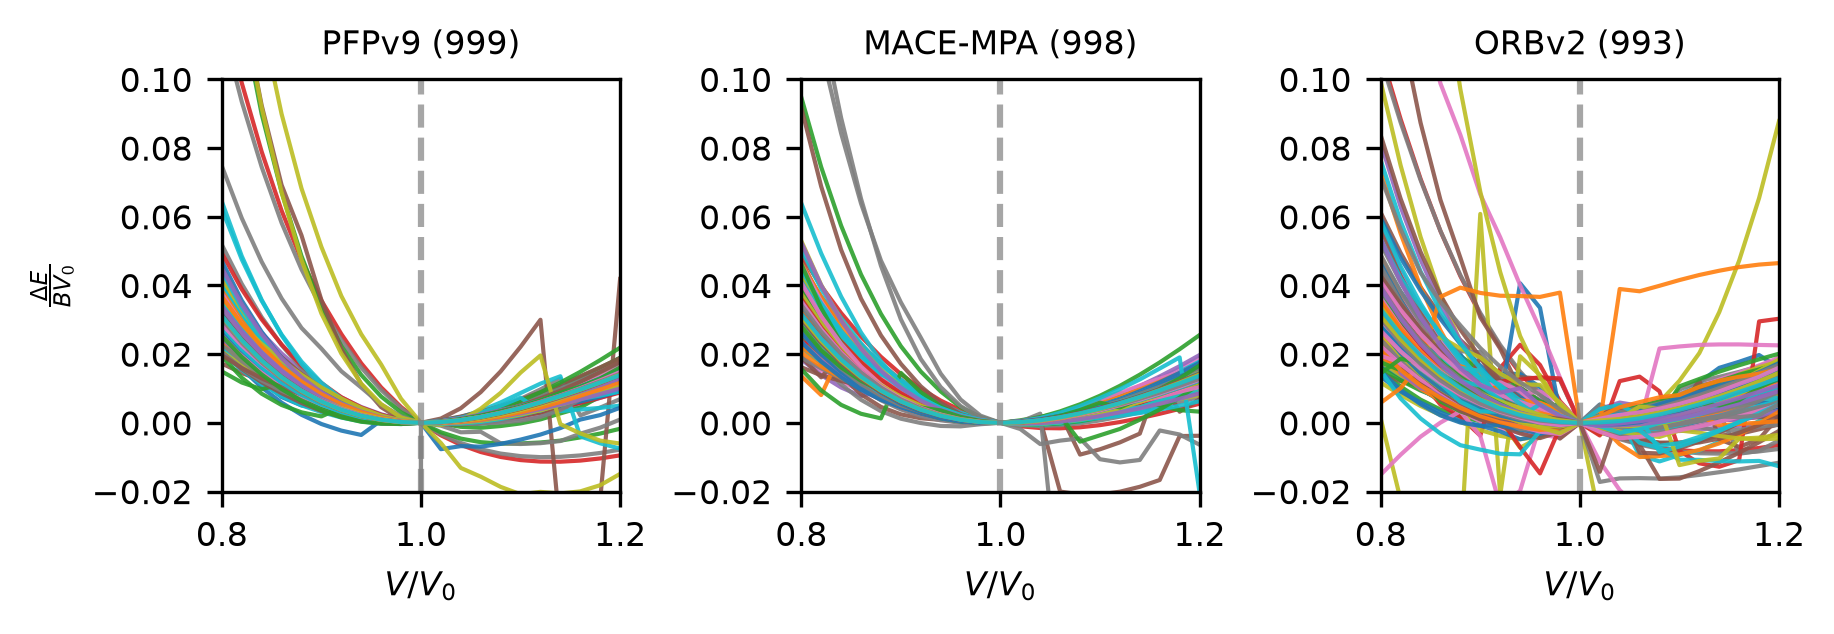
Figure 1: Bulk equation-of-state curves for PFPv9, MACE-MPA, and ORBv2
The eos_bulk benchmark probes how well each model reproduces physically sensible bulk equation-of-state behavior under compression and tension. A strong model should give smooth energy-volume curves, avoid excessive energy-difference sign flips, keep low tortuosity, and preserve the expected monotonic relationships in energy and derivative trends.
PFP v9 performs well across the full set of metrics rather than winning by only one standout number. It has the lowest energy-difference flip count (1.032), the lowest tortuosity (1.005), an almost ideal compression-energy Spearman score (-1.000), a very strong compression-derivative score (0.998), and a strong tension-energy score (0.987).
Overall, MACE-MPA is the closest competitor and slightly outperforms PFP v9 on the tension-energy correlation, but PFP v9 wins the overall benchmark because it is stronger on the smoothness and compression-related diagnostics. Its #1 aggregate rank reflects the best balance across the EOS task, rather than dominance in every individual metric.
Energy-volume scans (wbm_ev): rank#5
Table 5: wbm_ev performance comparisons in MLIP Arena.
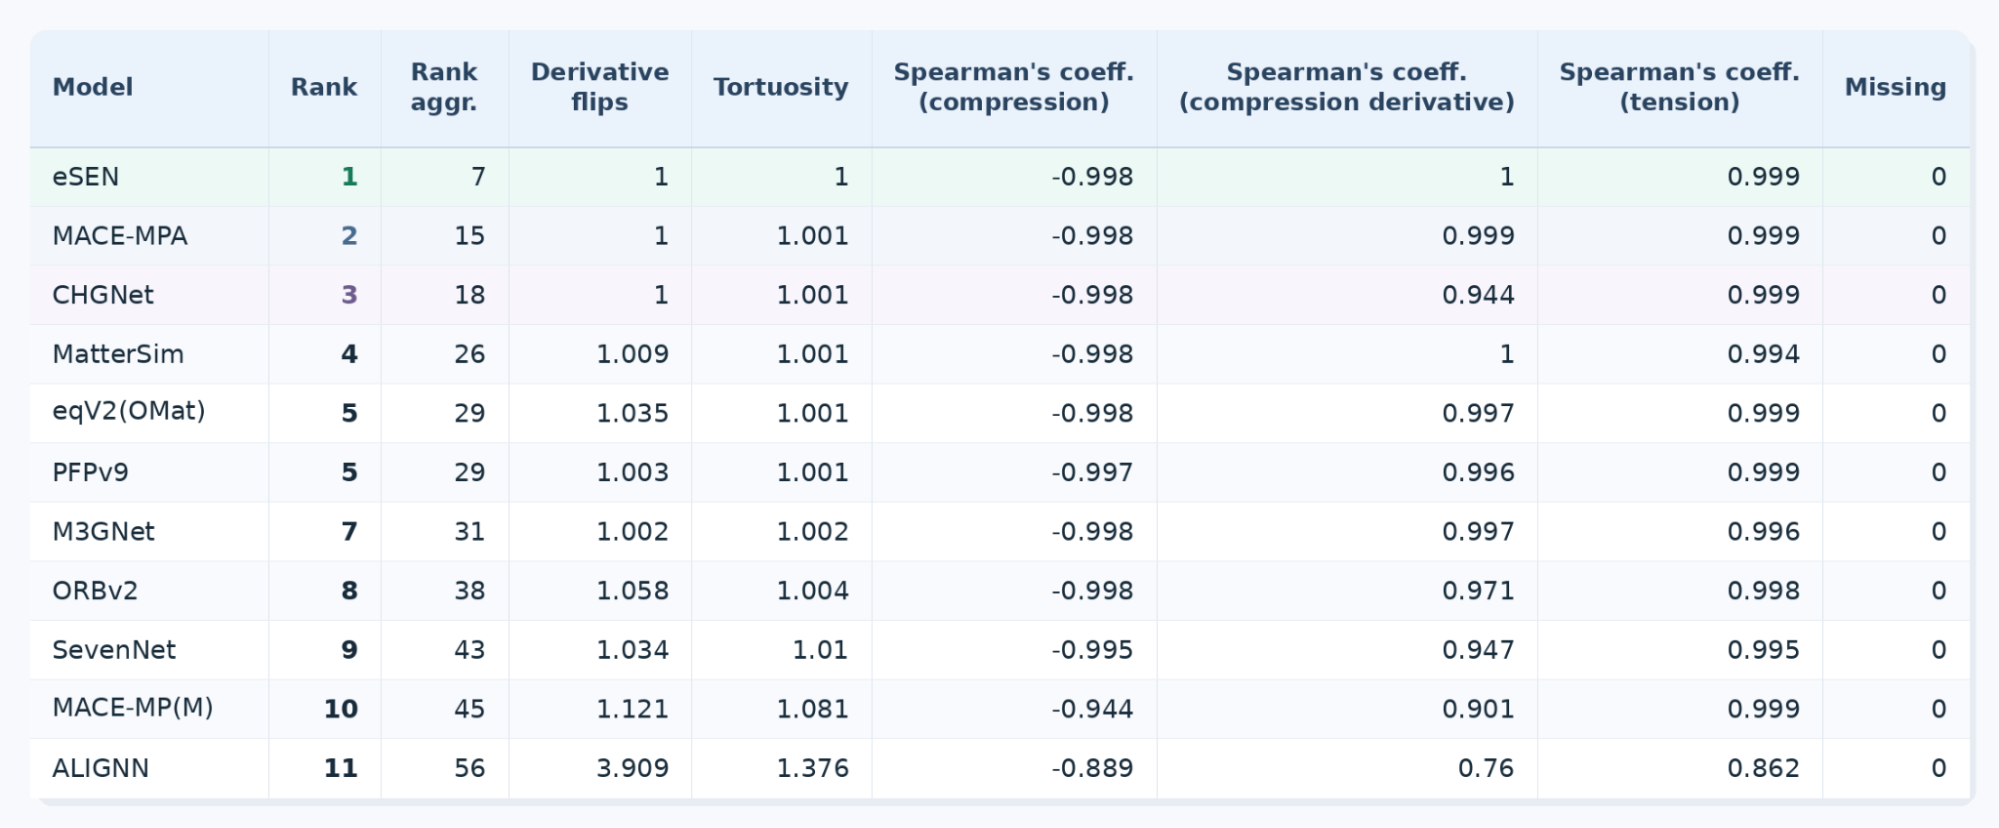
In the wbm_ev benchmark, PFP v9 ranks 5th overall. This task evaluates the qualitative shape and numerical regularity of energy-volume curves under ±20% cell scaling, using metrics such as monotonicity, tortuosity, and rank correlations. PFP v9 nevertheless shows stable behavior on this benchmark: it completes all 1000 structures, achieves an energy-difference flip score close to 1, and exhibits very low tortuosity. These results indicate that, despite not being the top-ranked model on wbm_ev, PFP v9 produces physically reasonable and numerically stable energy-volume trends across a broad inorganic structure set.
Stability: rank#1
Table 6: stability benchmark result
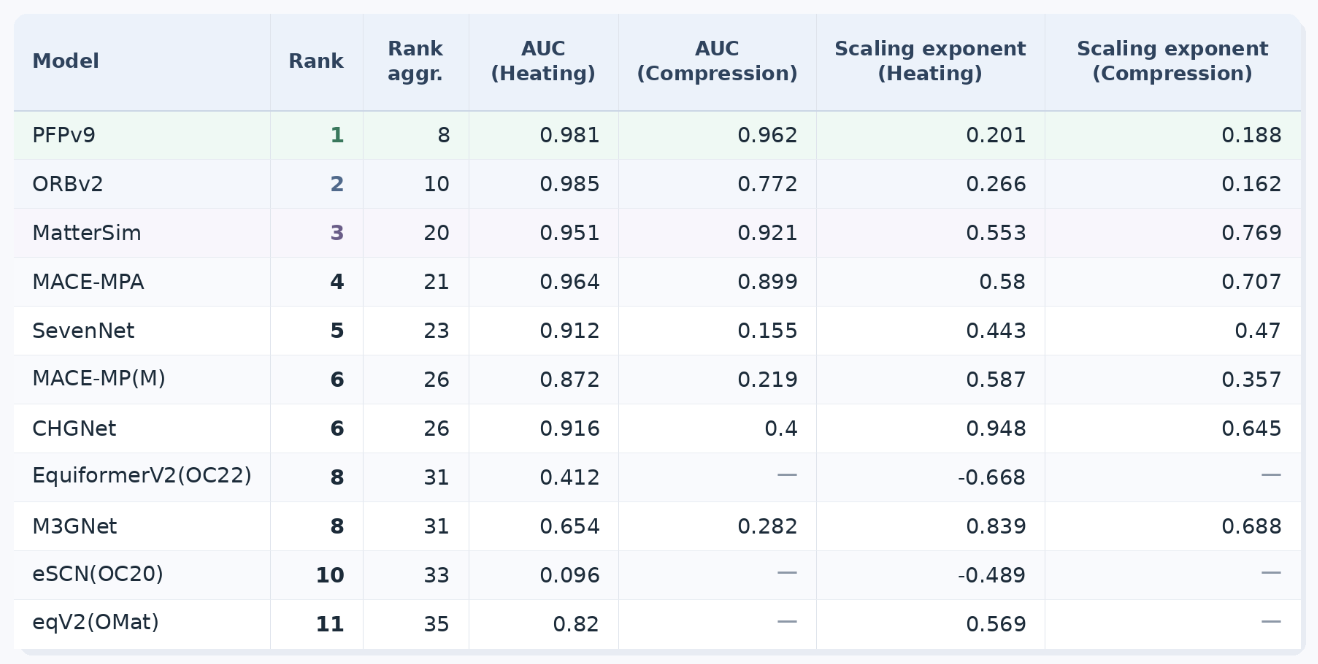
For the stability benchmark, the task evaluates whether each model can remain numerically and physically stable under heating and compression, using area under curve (AUC) metrics where higher values indicate better performance across increasingly difficult conditions. PFPv9 performs especially well because it is strong in both regimes: it has very high heating AUC and the best compression AUC, while also maintaining low scaling exponents for both heating and compression. That means its stability does not degrade as sharply as many competing models when the simulation conditions become more demanding.
Compared with the rest of the table, PFP v9 is the most balanced model. ORB v2 slightly exceeds it in heating AUC (0.985 vs. 0.981), but its compression AUC is much lower (0.772), whereas PFP v9 remains strong under both stress modes. MatterSim and MACE-MPA also perform well, but their higher scaling exponents suggest stronger degradation with increasing challenge. Overall, PFP v9’s #1 rank reflects consistently robust behavior rather than a single isolated metric win.
Combustion: rank#4
Table 7: Combustion performance comparison in MLIP Arena. PFP ranked fourth overall. For PFP v9, the reported performance is based on the mean across five combustion trials.
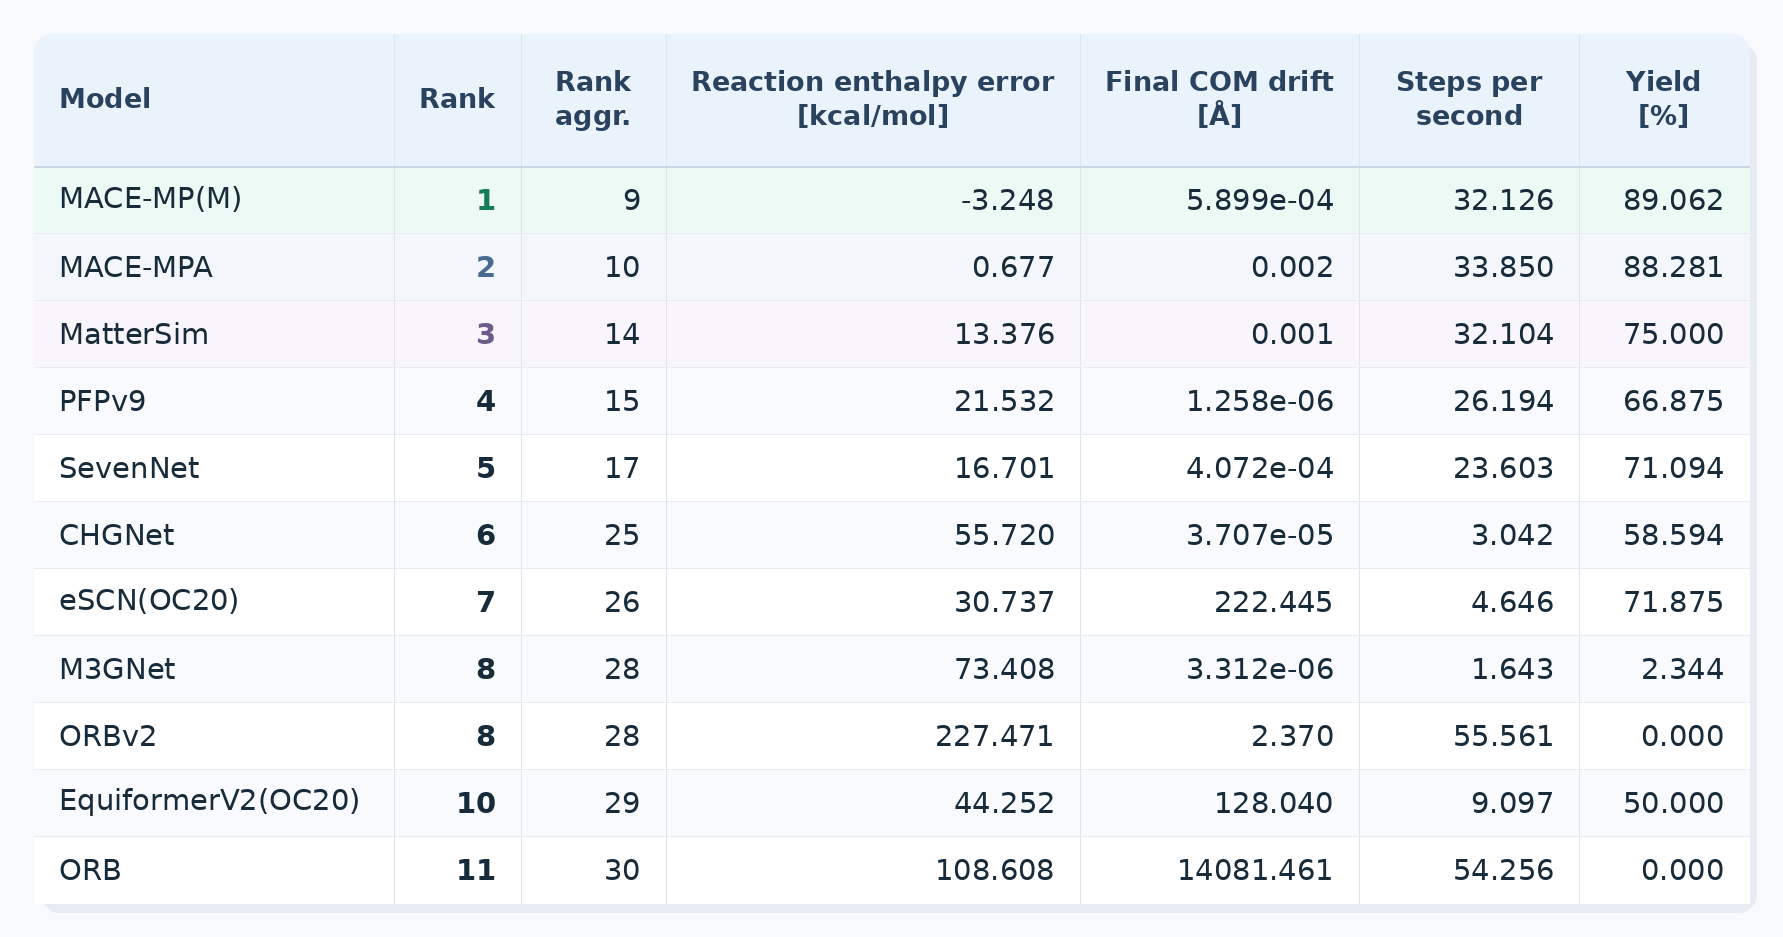
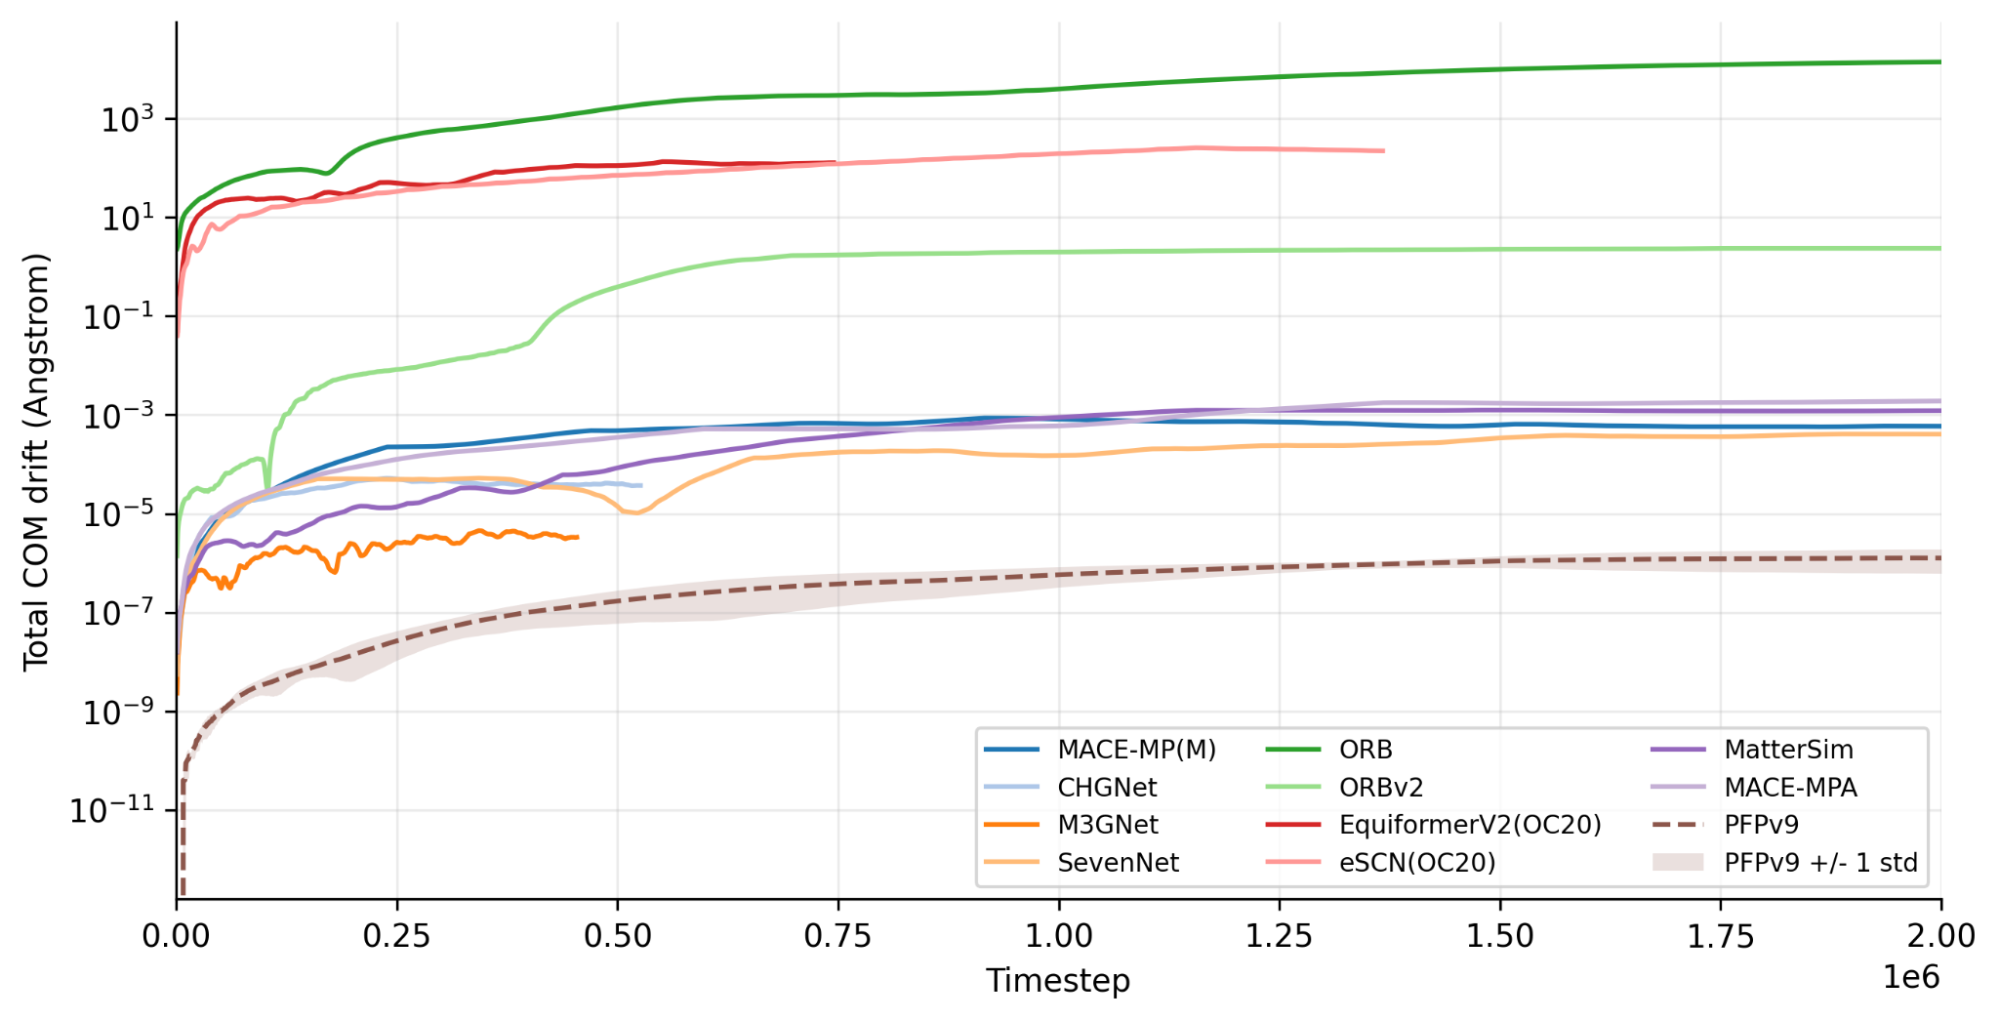
Figure 2: Final center of mass drift as timestep proceeds. The dashed brown PFPv9 curve is the mean over five independent trials, and the brown-shaded band shows ±1 standard deviation across those trials.
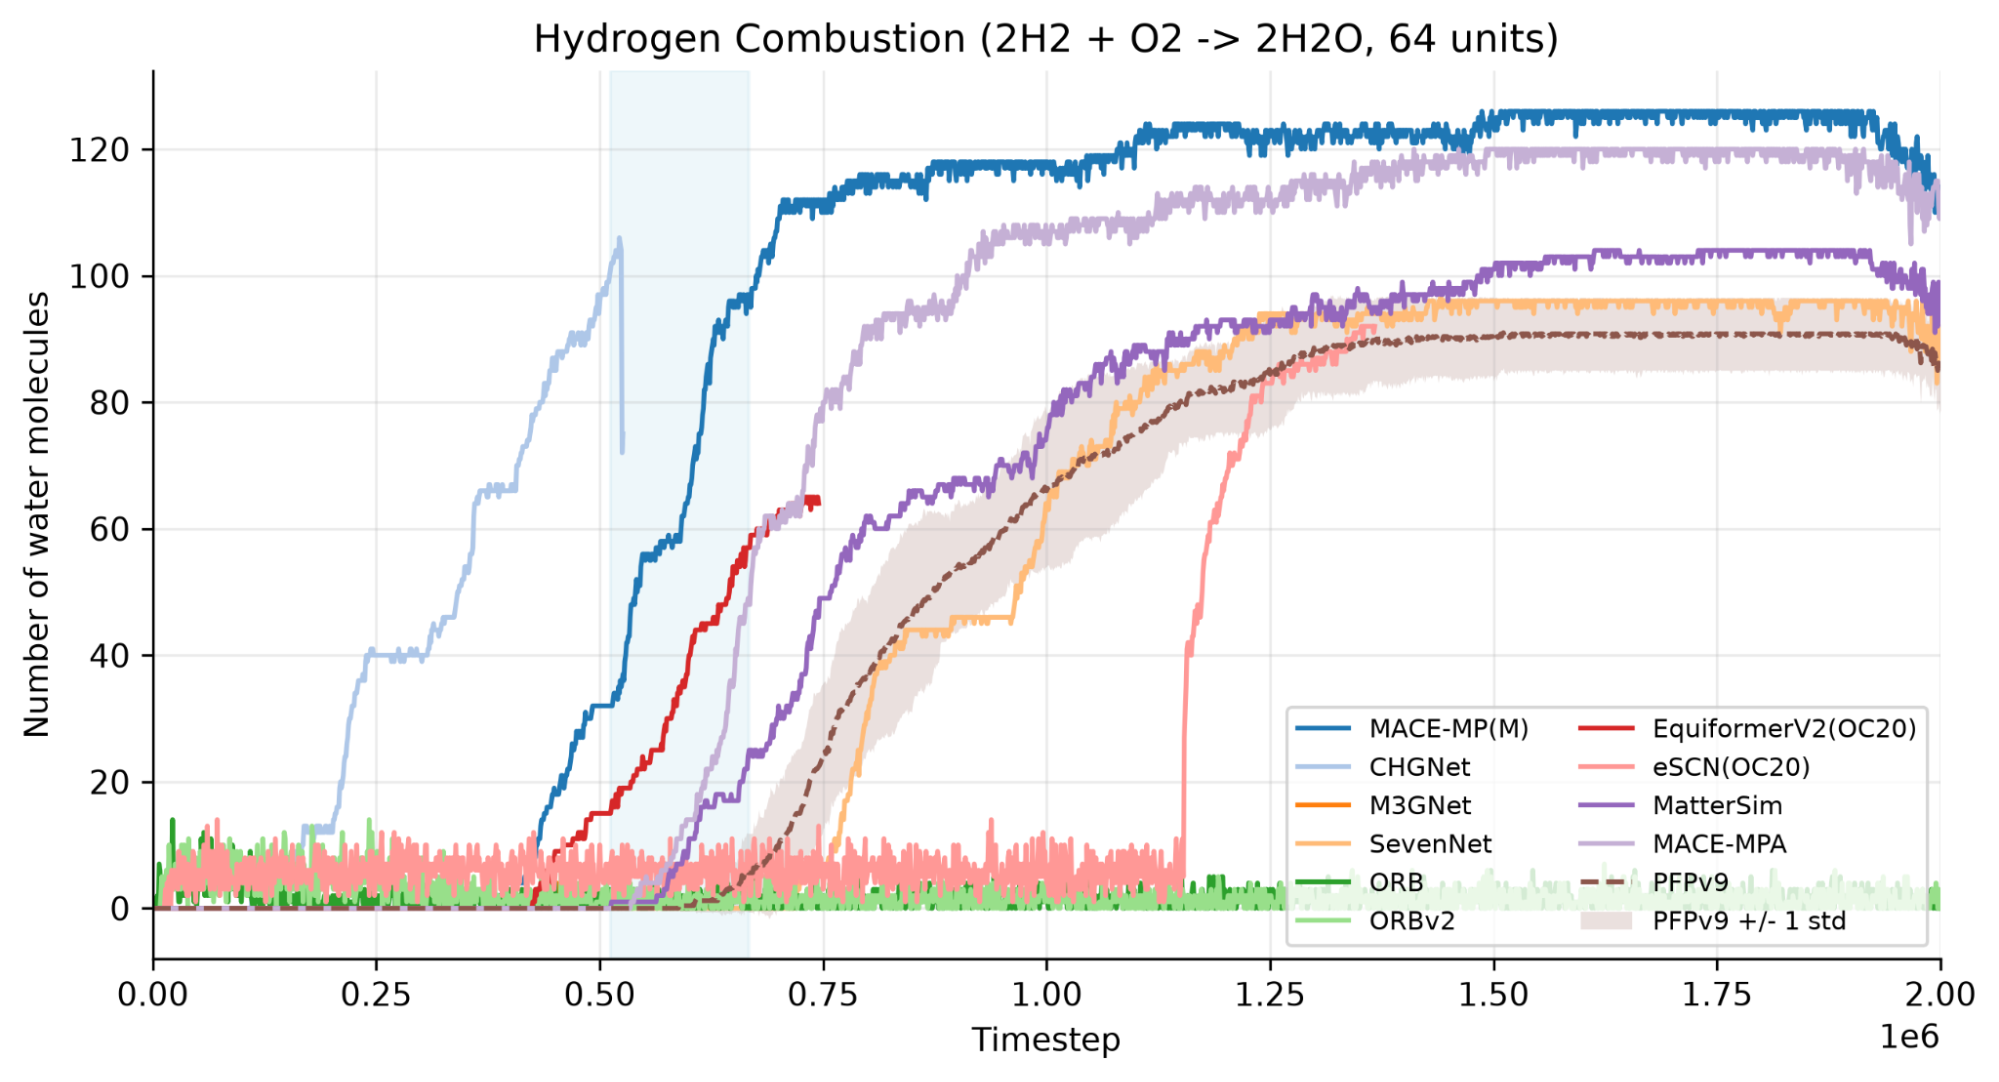
Figure 3: Number of water molecules as the simulation proceeds. The blue-shaded interval marks the timesteps when the prescribed temperature is within the experimental hydrogen flame-temperature range (2380–3000 K). The dashed brown PFPv9 curve is the mean over five independent trials, and the brown-shaded band shows ±1 standard deviation across those trials.
In the combustion benchmark, we observed some variation in performance across trials, likely reflecting the non-deterministic nature of molecular dynamics simulations. To account for this variability, we ran the combustion benchmark five times for PFP and reported the average performance. PFP v9 ranks fourth overall in this high-temperature reactive molecular dynamics test.
PFPv9 performs particularly well in numerical stability, with the smallest final center-of-mass drift among the reported models. Its trajectories therefore remain well controlled under the prescribed high-temperature reactive-MD protocol. The blue-shaded interval marks the timesteps when the prescribed temperature lies within the experimental hydrogen flame-temperature range. PFPv9 begins forming water near the end of this interval and continues to form products thereafter, indicating sustained reaction progress, although its final yield is lower than that of the highest-yield models.
Overall, PFP v9 shows strong numerical stability in this benchmark, while reaction-energy estimation remains an area for further improvement.
Additional benchmark of Hydrogen Combustion
The combustion benchmark in MLIP Arena evaluates reactive molecular dynamics under high-temperature conditions, but its outcome can vary across trials because molecular dynamics trajectories are sensitive to small numerical differences. Consequently, the benchmark is useful as a stress test of reactive stability, but it does not isolate thermochemical accuracy in a fully deterministic setting. In our five PFP v9 trials, the most favorable run achieved a higher combustion-task rank and would also affect the overall ranking.
To address the stochasticity of the combustion benchmark in the MLIP Arena, we evaluated PFP on a second hydrogen-combustion benchmark based on the original MACE-MPA paper, specifically Supplementary A.8 in Batatia et al. [2]. This benchmark measures heats of reaction for 19 elementary hydrogen-combustion reactions. Unlike the molecular dynamics benchmark, this protocol is fully deterministic under fixed software and optimization settings, since it does not involve Monte Carlo sampling, randomized initialization, or stochastic trajectory generation. Any remaining differences across runs are expected to be limited to small floating-point numerical effects.
We compared PFP v9 with PBE calculation mode (PFPv9 PBE), PFP v9 with r2SCAN calculation mode (PFPv9 r2SCAN), and MACE-MPA. For each method, we computed the root mean square error (RMSE) between the predicted reaction energies and the experimental heats of reaction digitized from the MACE-MPA paper. This provides a direct measure of thermochemical prediction accuracy in kcal/mol.
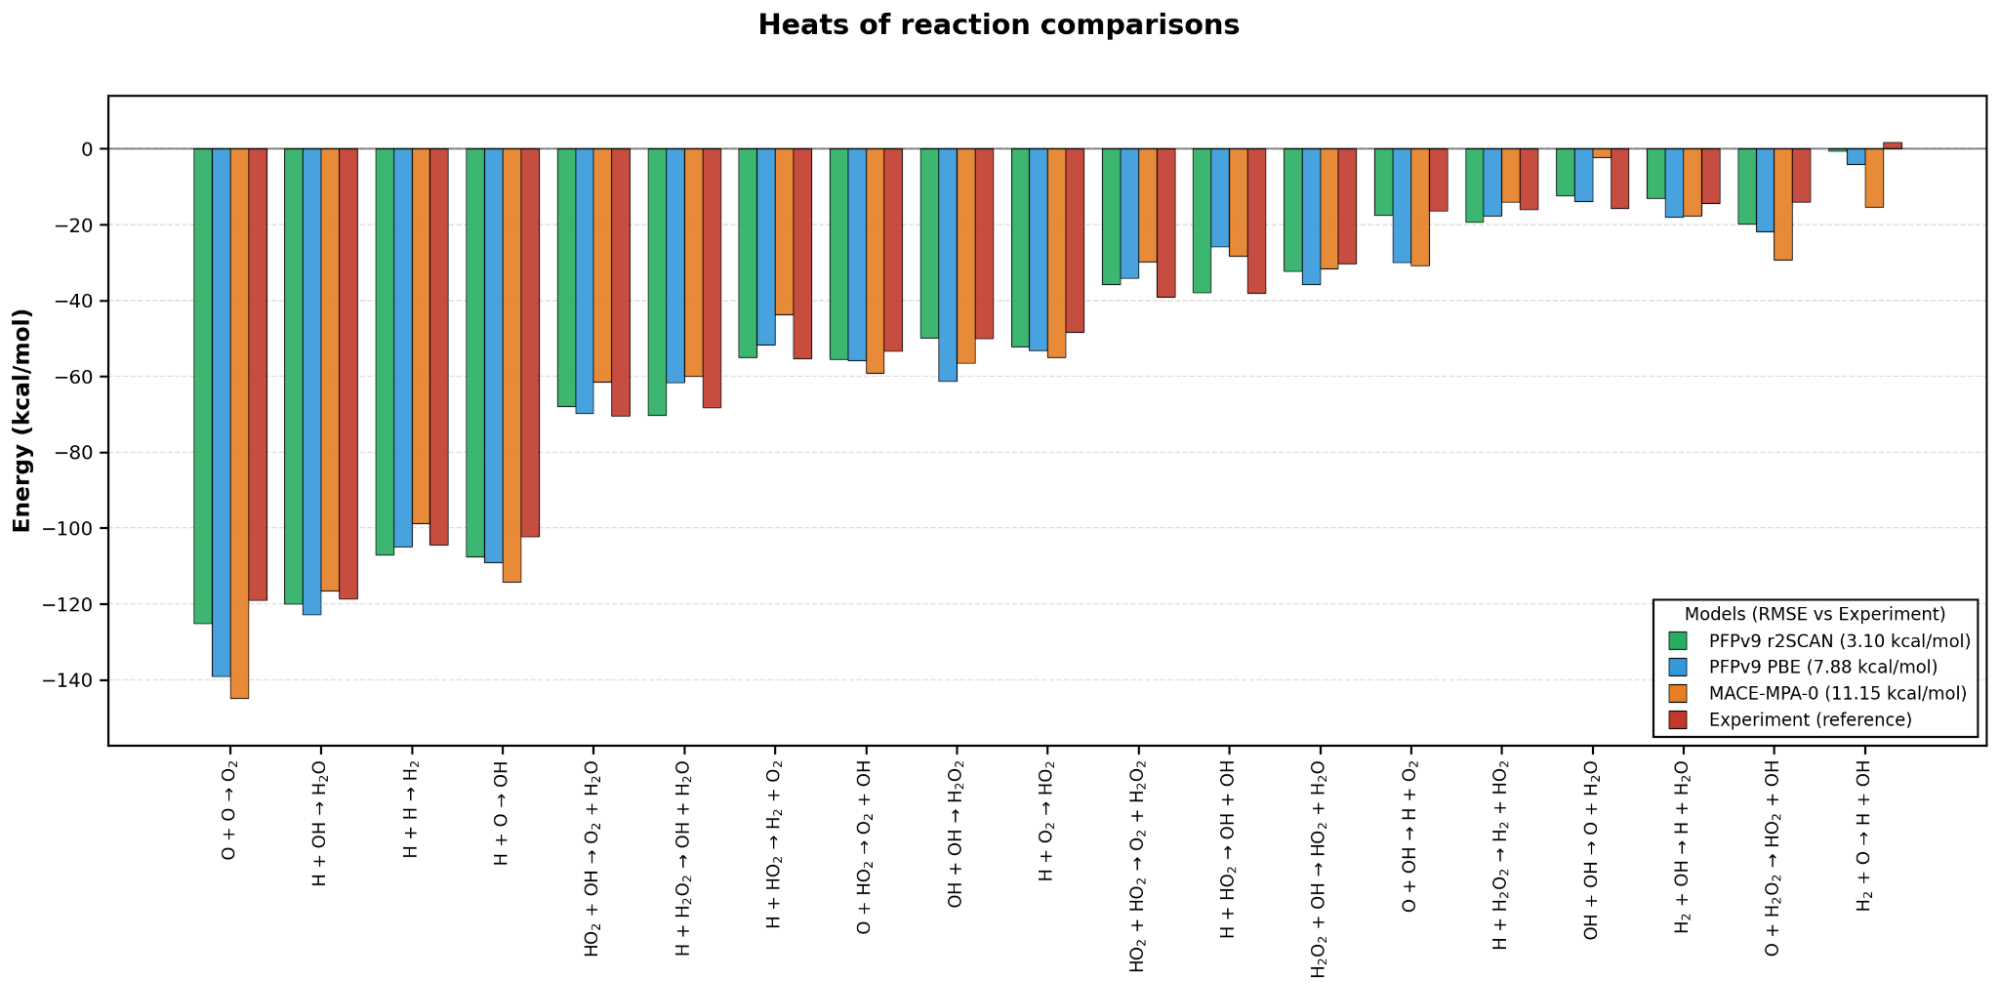
Figure 4: Comparison of predicted heats of reaction for key hydrogen combustion reactions predicted by PFP v9 and MACE-MPA
The results show a clear ranking: PFPv9 r2SCAN achieves the best performance with 3.10 kcal/mol RMSE, followed by PFPv9 PBE at 7.88 kcal/mol, and MACE-MPA at 11.15 kcal/mol. Notably, even PFPv9 in PBE mode outperforms MACE-MPA by approximately 29%. The choice of density functional matters significantly, with r2SCAN reducing error by 56% relative to PBE.
While the reactive MD benchmark evaluates stability and reaction behavior along finite-temperature trajectories, this benchmark directly measures reaction-energy accuracy. Under this protocol, PFP v9 shows strong performance, particularly when used with the r2SCAN calculation mode.
Supplementary: Performance without speed metric
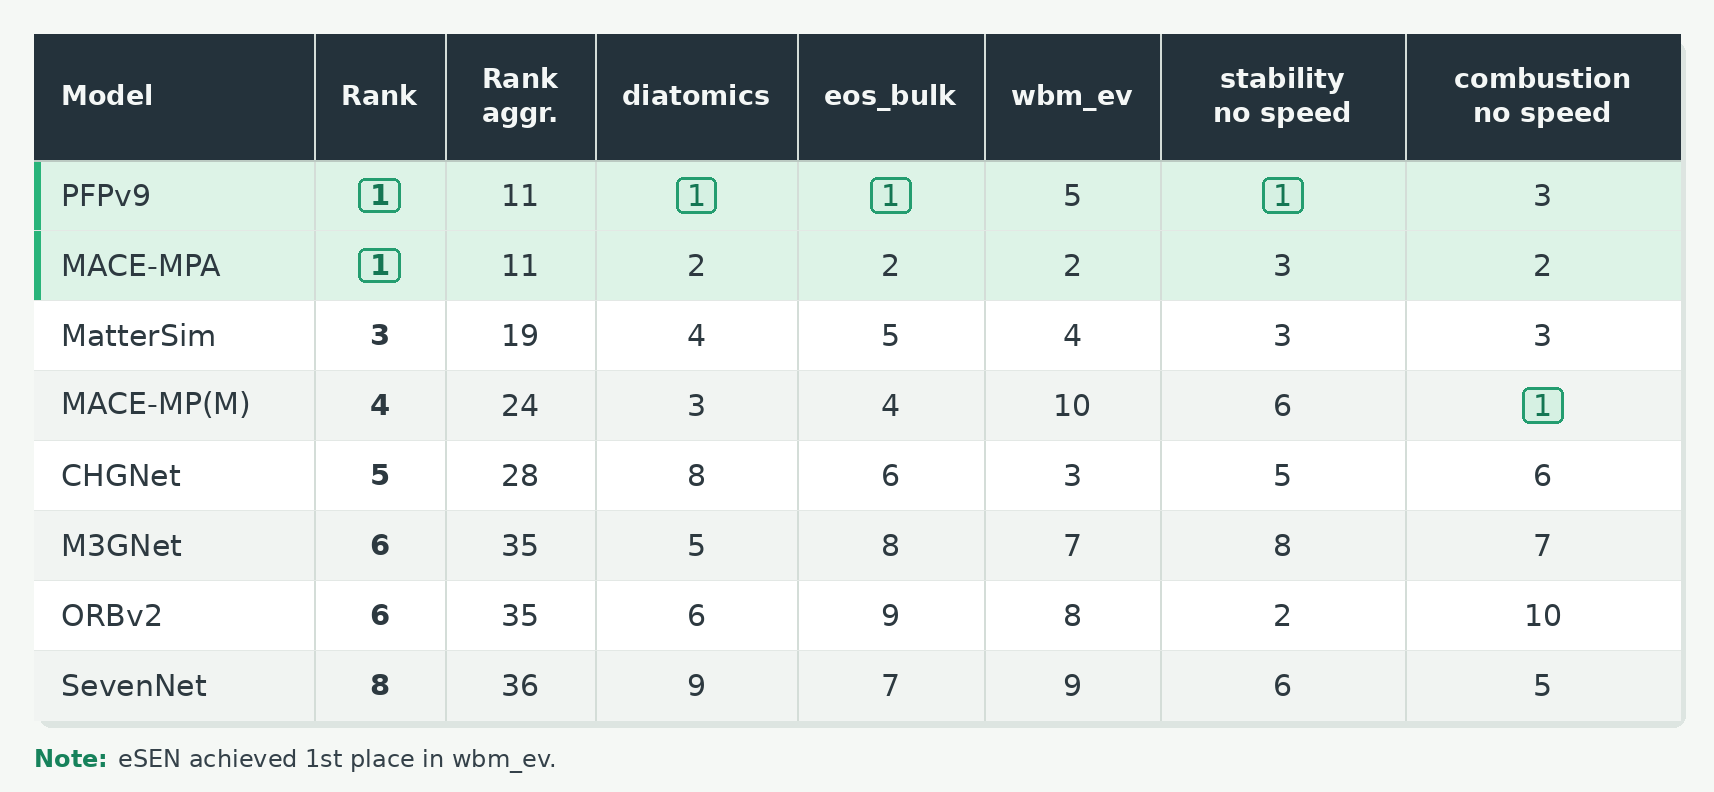
One could argue that the speed comparison is not entirely fair because the validation runs were performed on different hardware. To address this concern, we also report the overall ranking of PFP v9 after excluding the speed metric from the stability and combustion benchmarks. The top-ranked methods remain unchanged under this alternative evaluation, indicating that the main ranking is not driven by differences in computational speed.
Table 8: Overall ranking without speed metrics
References:
[1] Y. Chiang et al., NeurIPS 38 (2025). https://papers.nips.cc/paper_files/paper/2025/hash/bfa45223cc236855dbaa5c468c809896-Abstract-Datasets_and_Benchmarks_Track.html (https://huggingface.co/spaces/atomind/mlip-arena)
[2] I. Batatia et al., J. Chem. Phys. 163, 184110 (2025). https://pubs.aip.org/aip/jcp/article/163/18/184110/3372267/A-foundation-model-for-atomistic-materials