Blog
2020.12.01
Importance of Spatial Context in Football Player Performance Evaluation
Tag
Alexis Vallet
This is a guest blog from summer intern Vaasudev Narayanan ( @vaasudev96 ).
In this internship project, we propose a novel method for player performance evaluation in football. We work on data from a major professional football league. We incorporate the spatial context of all the players on the field to calculate the value of an action.
Introduction
Why should we care about a data-driven player performance evaluation method for football players?
- Human evaluation is subjective and biased
As pointed out by Pappalardo et al. in Human Perception of Performance, humans tend to focus on the flashy aspects of the game and do not always objectively make use of all the available information. - Need to give Unsung Heroes their due!
In general, there are a lot of actions performed by players who are not directly involved with the goal event. Conventional metrics such as number of goals scored & number of assists made fail to capture the value of such actions that have indirectly impacted the scoreline. - Scouting
A data-driven approach will aid in expanding the set of players that can be evaluated by football clubs (provided that the data is available for those leagues).
Challenges
Now that we have established the need for such a method, let us look at the challenges involved in developing one.
- Low-scoring nature of football
Most of the matches in football end up with score-lines such as 1-0, 2-1, 3-0. As a result, the majority of the actions do not directly impact the scoreline. Thus, it is difficult to judge the importance of an action in the presence of such a sparse reward signal. - Incorporating game context
Not all actions are equally important. For instance, a pass between two defenders of the same team under no pressure whatsoever is much less valuable compared to a through pass in the opponent’s half. - Continuous nature of football
Football is a tactical, free-flowing game and thus harder to analyze. Unlike cricket or baseball where the game is segmented into well-defined plays, football has minimal interruptions which are not well-defined. The ball can go out of play or a player might commit a foul at any moment of the game. - Team Game
In football, several individual players work together for a common objective leading to a single reward. To measure the contribution of every individual is essentially to distribute the reward to all the players which is not a trivial task.
Dataset Statistics
Our dataset comprises matches from a major professional football league. We performed our experiments on a total of 1223 matches. The training set comprises 915 matches and the testing set comprises 306 matches.
Background
We base our approach on Actions Speak Louder Than Goals: Valuing Player Actions in Soccer by Decroos et al. Feel free to jump to ‘Observation About Approach’ section if you are familiar with the paper.
Core Idea
In football, the objective is to win the game by scoring more goals than the opponent team. With this simple philosophy, we rate players highly who perform actions such that:
- The probability of their team scoring increases
- The probability of their team conceding decreases
That is, we value players who perform actions which have both high offensive and defensive value.
Terminology
Let us now look at the terminology which will be used in the rest of the blog. We segment the game into a set of actions \([a_1, a_2, …, a_m ]\) .
\(S_i : [a_1, a_2, …, a_m ]\)
\(S_i\) is the game state when \(i\) actions have been performed.
\(P_{\text{Scores}}(S_i, x)\): Probability of scoring a goal for team \(x\), for game state \(S_i\).
\(P_{\text{Concedes}}(S_i, x)\): Probability of conceding a goal for team \(x\), for game state \(S_i\).
Value of an action
Given the terminology, let’s understand how to get the value of an action. To value an action \(a_i\) for a team \(x\), we need to see the change in scoring and conceding probabilities resulted by moving the game from state \(S_{i-1}\) to \(S_i\) by action \(a_i\). The change in scoring probability or the offensive value of an action will then be,
\(\Delta P_{\text{Scores}}(a_i, x) = P_{\text{Scores}}(S_i, x) – P_{\text{Scores}}(S_{i-1}, x) \)
\(\Delta P_{\text{Concedes}}(a_i, x) = P_{\text{Concedes}}(S_i, x) – P_{\text{Concedes}}(S_{i-1}, x)\)
So, the overall value of an action will be the sum of its offensive value and defensive value.
\(V(a_i, x) = \Delta P_{\text{Scores}}(a_i, x) + (-\Delta P_{\text{Concedes}}(a_i, x))\)
We negate the conceding probability to get the defensive value of the action because a negative change in the conceding probability implies that the defensive action helped the team.
Ratings
Given the above setup, we can rate a player based on the set of actions performed by the player, normalized by the play-time.
\(\text{rating}(p) = \frac{90}{m} \sum_{a_i \in A_p}V(a_i)\)
\(A_p\): Set of actions performed by the player
\(m\): No. of minutes played
Estimating Scoring & Conceding Probabilities
So, are we done? No. We were assuming up to now that we had access to \(P_{\text{Scores}}(S_i, x)\) and \(P_{\text{Concedes}}(S_i, x)\) for every action. Formally,
Given: game state \(S_i\), where \(x\) is the team in possession of the ball at \(S_i\), we need to estimate:
- \(P_{\text{Scores}}(S_i, x)\)
- \(P_{\text{Concedes}}(S_i, x)\)
So, we now have two classification tasks at hand!
Feature Engineering
In order to perform the classification, we encode the game state by a combination of action-specific and game context specific features. For constructing the ground truth, we label a particular game state as positive if a goal occurs in the next \(k\) actions, where \(k\) is a hyperparameter.
Observations About Baseline Approach:
Things we liked about the approach:
- Values every action that a player performs
- Uses the task of goal scoring/conceding prediction to get the value of an action; unlike previous approaches which defined their custom metrics which were not intuitive – see PlayerRank or Pass Shot Value for instance.
Things we felt were lacking in the approach:
- They say using tracking data is a minor extension, which it is but don’t really show how or give possible ideas.
- They don’t provide sufficient experimental results (plots, metrics) for the scoring/conceding models
- Do not explain how they chose the hyperparameters \(N\) and \(k\)
- Focus only on on-the-ball actions
With these observations in mind, we now present the way we attempted to improve their model.
Our Approach – Simple Tracking Extensions
The entire player evaluation framework rests on how well we can estimate the scoring and conceding probabilities.
Hypothesis: In order to better estimate the goal scoring/conceding probability, we need to incorporate the spatial context of all the players.
We hypothesize that along with the action-specific and game-specific features (i.e. the baseline features), the positions of players (home + away) who are not actually performing an action on the ball also contributes to estimating the goal scoring/conceding probability.
To test this hypothesis, we engineered different features based on the tracking data coordinates of the players.
Tracking Extensions
- Absolute Locations
- Absolute Locations + Speed
- Absolute Locations + Velocity Vector
- Displacement Vectors (Black Lines in figure below)
- Displacement Vectors + Speed
- Displacement Vectors + Velocity Vectors
- Absolute Locations + Speed + Trajectory (Red Lines in figure below) + Displacement
Displacement: Relative position to the player with the ball
Trajectory: Average direction the player moved in the last 2 seconds
‘+’: Concatenation
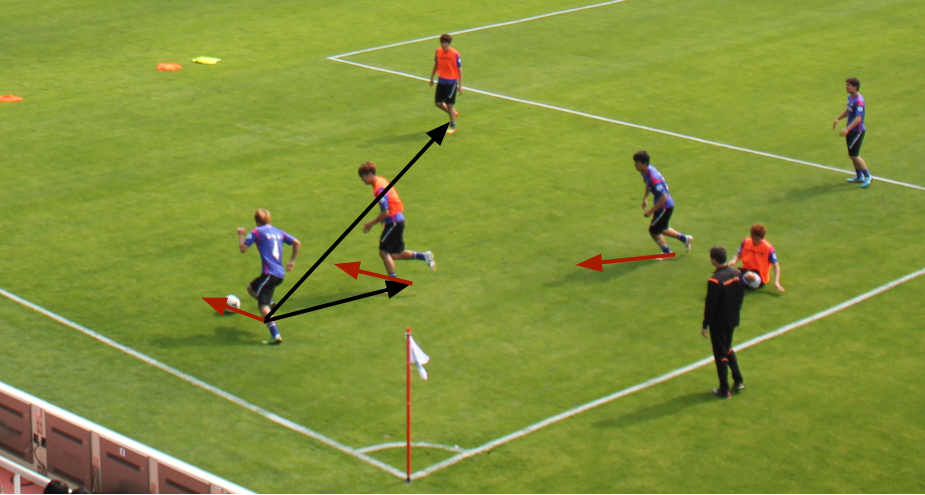
Fig. Showing displacement (black arrows) & trajectory (red arrows).
We simply appended the tracking features to the baseline features and trained classifiers with the new feature set.
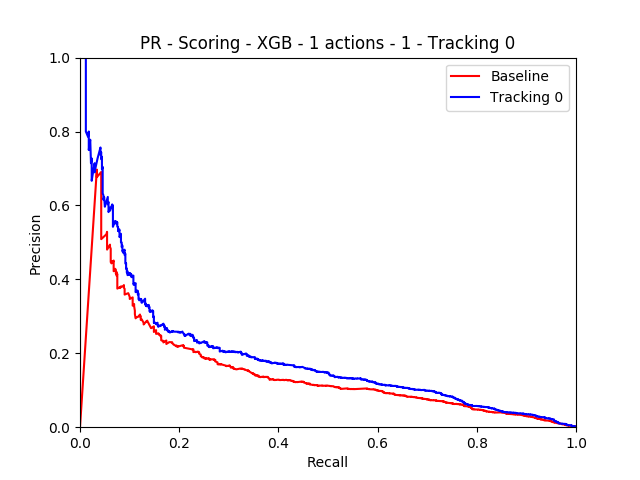
Fig. PR curve
For the scoring model, we observed performance improvements of about 35% on the mean precision metric. We achieved the best performance for Absolute Locations + Trajectory.
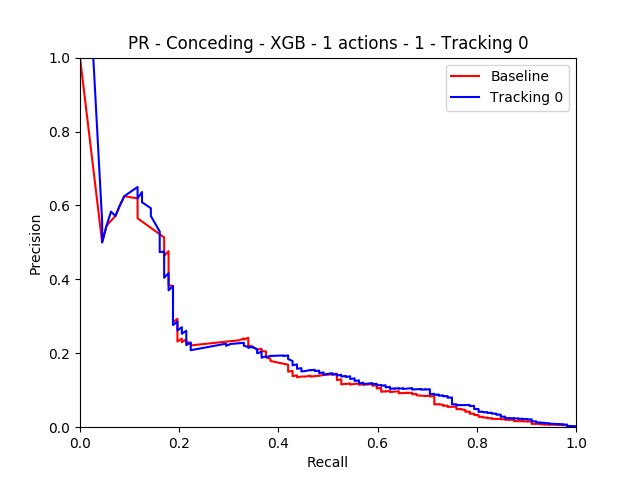
Fig. PR Curve
For the conceding model, we didn’t observe any difference in the model performance with the addition of tracking data. We also conducted analysis across the two hyper-parameters: \(N\) and \(k\), where \(N\) is the number of actions used to represent a game state. We wanted to see the change in model performance across a range of these hyperparameters.
Study 1:
Varying \(k\) and keeping \(N\) constant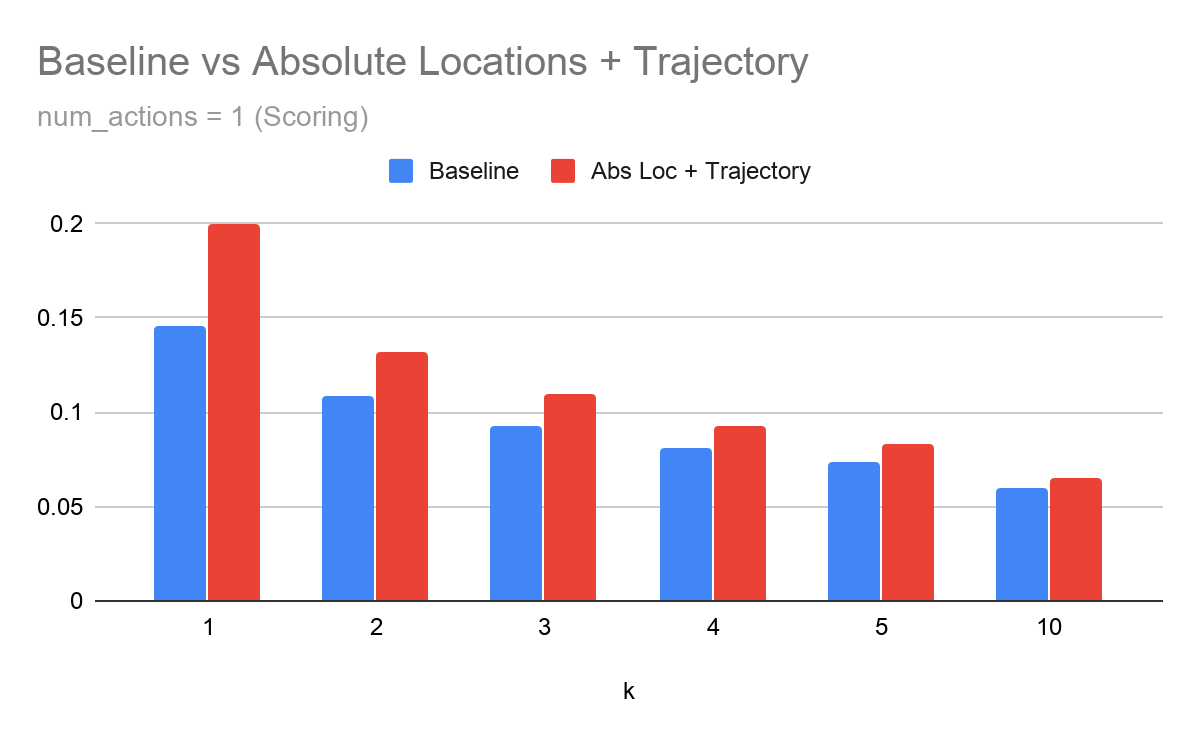
Fig. Scoring Model
For the scoring model, we observe that as \(k\) increases, the tracking features are not able to improve model performance.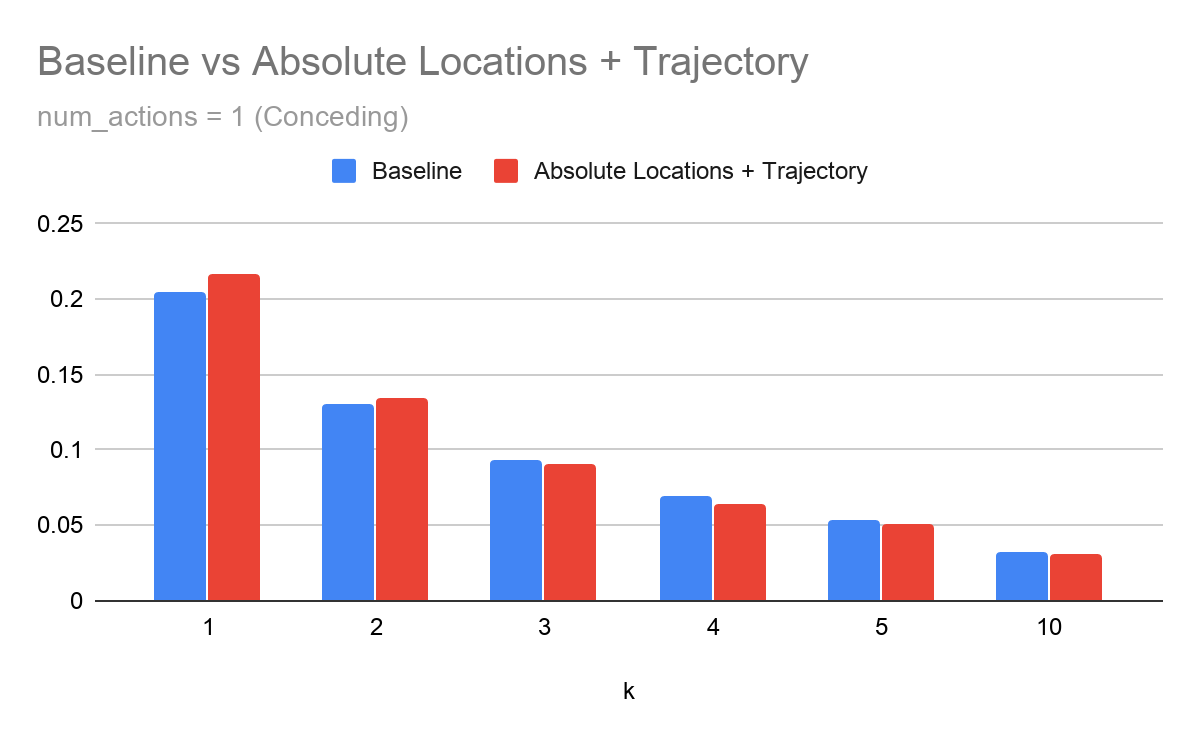
Fig. Conceding Model
For the conceding model, we observe a similar trend, but the performance is roughly similar and for larger values of \(k\) the tracking extension actually performs worse than the baseline approach by a small margin.
Study 2:
Varying \(N\) and keeping \(k\) constant
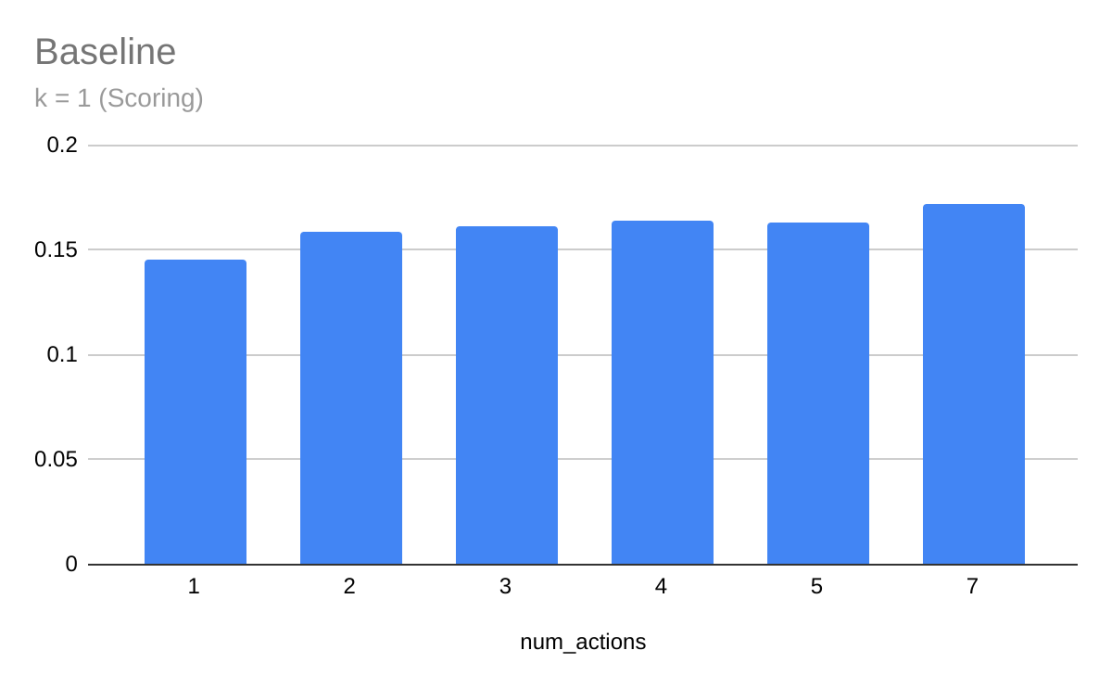
Fig. Scoring Model
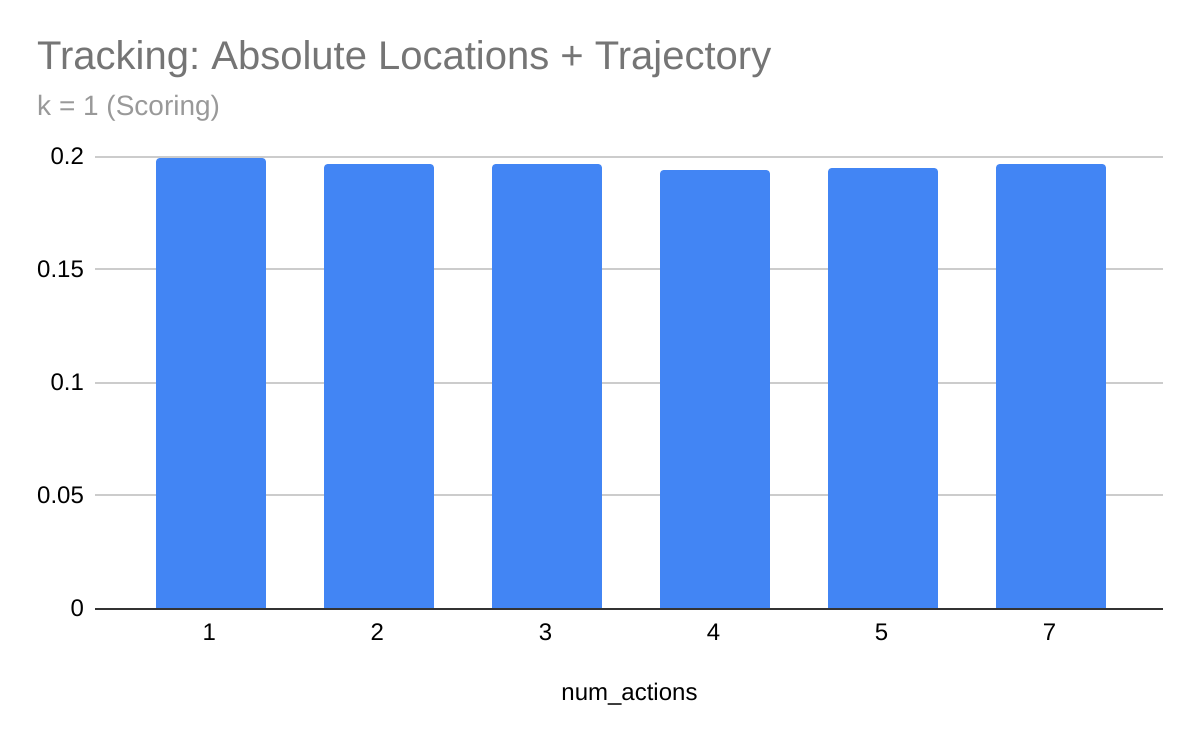
Fig. Conceding Model
For both scoring and conceding models, we observe that varying \(N\) did not affect model performance significantly.
Conclusion
We found that spatial context of the players who are not directly involved with the ball, plays an important role in estimating the probability of scoring by a team. We show that by simple extensions we could achieve a decent improvement in model performance. It will also be interesting to see why our extension was not able to improve the performance of the conceding model. We feel that there are better ways to capture the spatial and temporal context of the game and hence improve both the scoring/conceding models.
Tag
