Blog
This post is a contribution by Choi Chun Ming, who was an intern at PFN.
Introduction
Hello, I am Choi Chun Ming from Kyoto University. In this internship, I have been working on observability for PFP API in Matlantis. Especially, I took on the challenge of continuously tracing bottlenecks by integrating OpenTelemetry into the PFP API. The PFP API is made up of complex components, and it is not easy to incorporate OpenTelemetry. Here, we will report about challenges we had to overcome for the integration at.
Background
Matlantis is an atomistic simulator powered by deep learning. It is hundreds of thousands of times faster than conventional methods and is easy to use, requiring only a browser. The core technology of Matlantis is PFP. We provide PFP API service in Matlantis.
The architecture of PFP API is as follows. Users are provided with a Jupyter Notebook environment, where they can run simulations with a Python program. The client library used inside these Python programs makes calls to the API gateway, which has queues of requests. Consumers connect to the API gateway to fetch batches of requests, which are then sent to an API server for simulation. The API server makes use of an in-house library which performs the computation on a GPU. The responses are then sent back to the notebook.
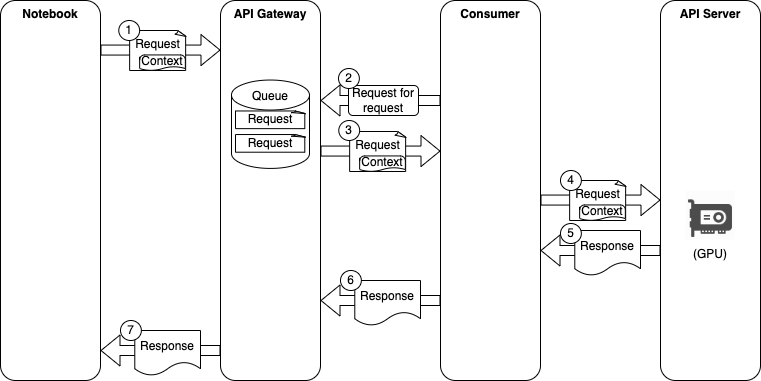
Architecture of PFP API
Matlantis processes hundreds of thousands of requests per minute. As each request is processed by several components including API gateway, consumer and API server, it is difficult to identify the bottleneck in each request. Metrics such as average process time can be collected by instrumenting at API gateways, however in order to truly understand how much time is spent in each part for a single request, the use of distributed tracing is required.
OpenTelemetry and Batch Workload
For introduction to OpenTelemetry and distributed tracing, refer to this series by Signoz.
Usually, when microservices use gRPC unary requests or REST, instrumentation libraries solve the problem of context propagation. However, in our case, as the consumer obtains the tasks through gRPC streaming connection with the API gateway, there is no header and instrumentation libraries cannot propagate the context for us, so we have to implement the context propagation manually.
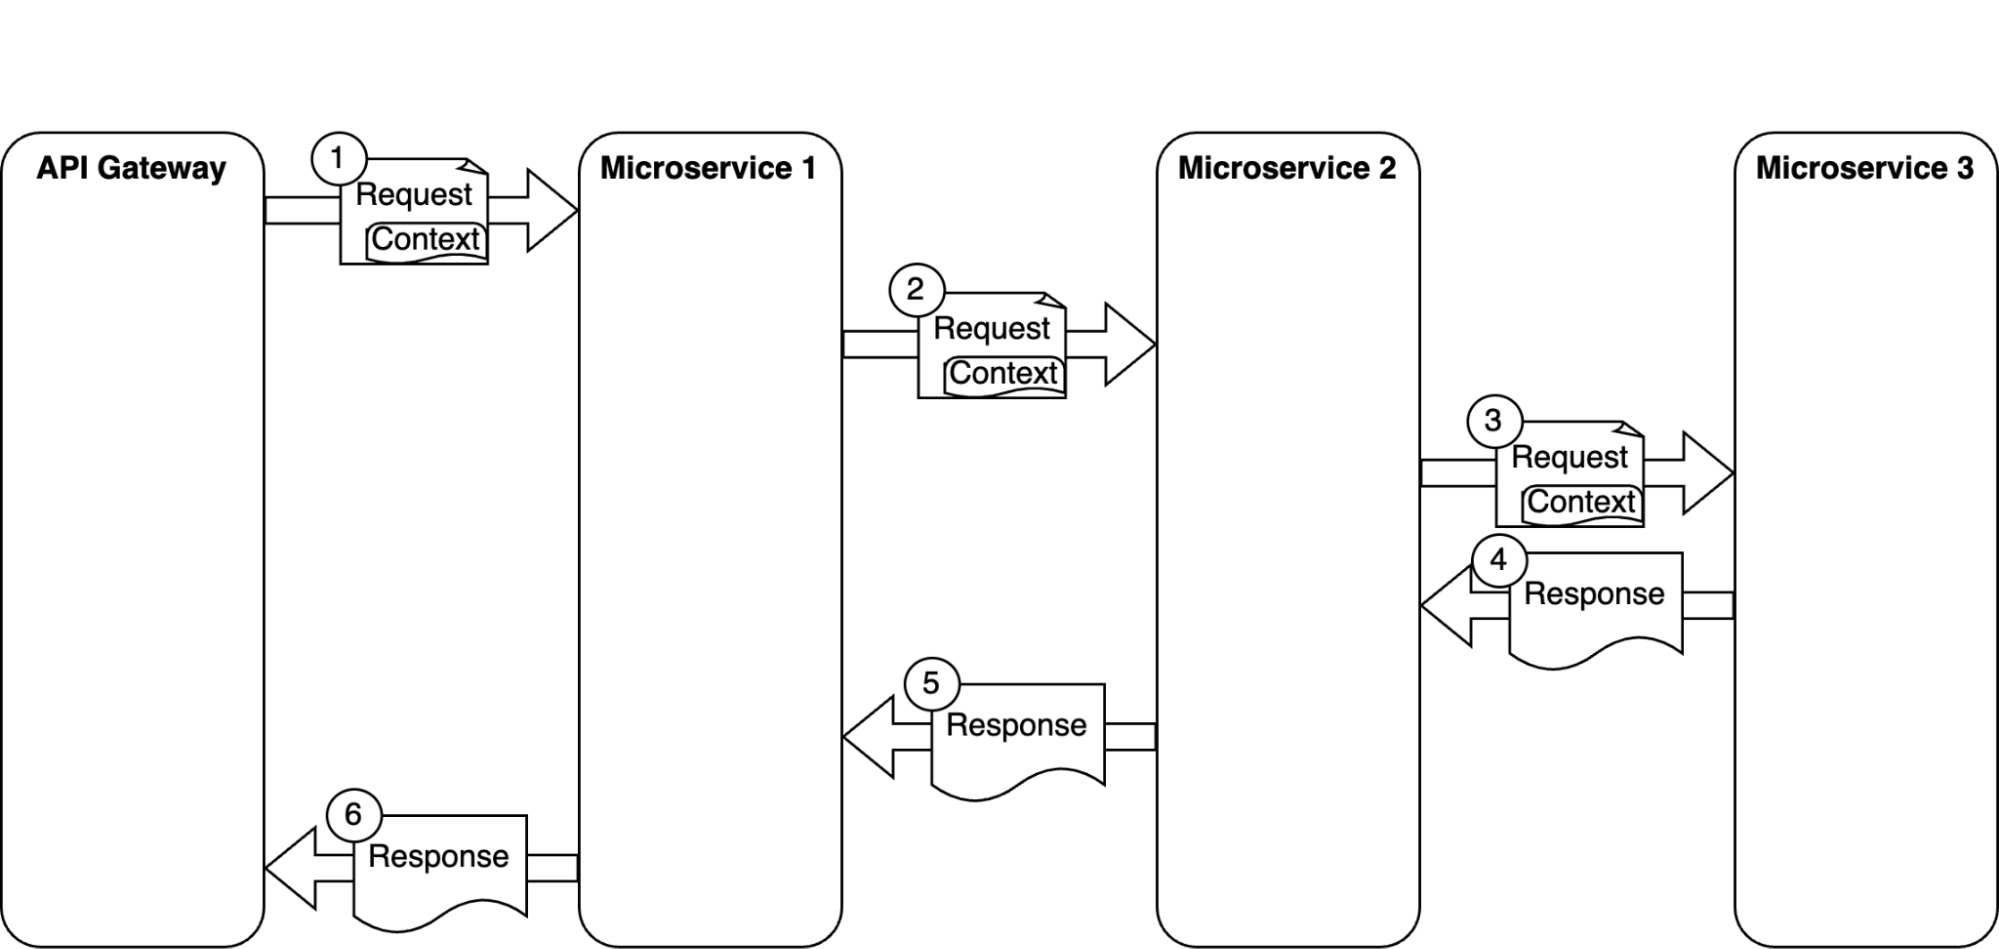
Typical microservice request & response flow

PFP API request & response flow
Batch Workload and Sampling
OpenTelemetry also provides a mechanism called sampling, allowing us to only send a portion of traces to the backend. Usually, probabilistic sampling is used, where for instance only 1% of all traces are sent. However, due to the batch workload, we’re unable to propagate the context information. Consequently, span links are generated indiscriminately, regardless of whether a trace is actually sampled. Ultimately, this produces span links connected to spans that have not been sampled.
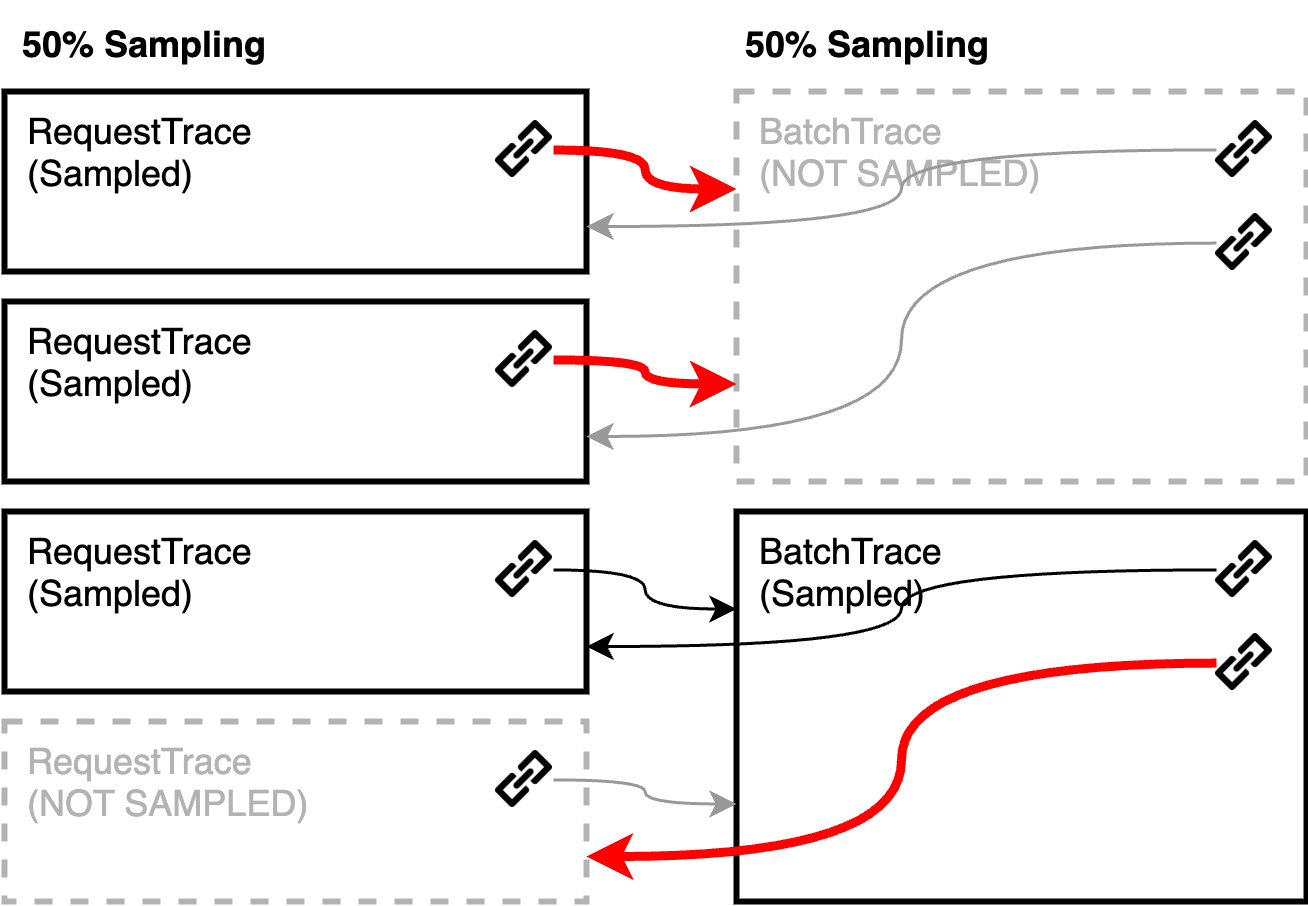
Before: independent sampling (red arrows are links to non-sampled spans)
In order to prevent this, we must implement our own samplers. First, when we extract the span contexts from each request in the batch, we can see whether the span is sampled or not. If we create a span for the batch trace incorporating this information, we can extract this information and use it in the decision whether to sample the trace or not. As a result, we can ensure all trace links are valid.
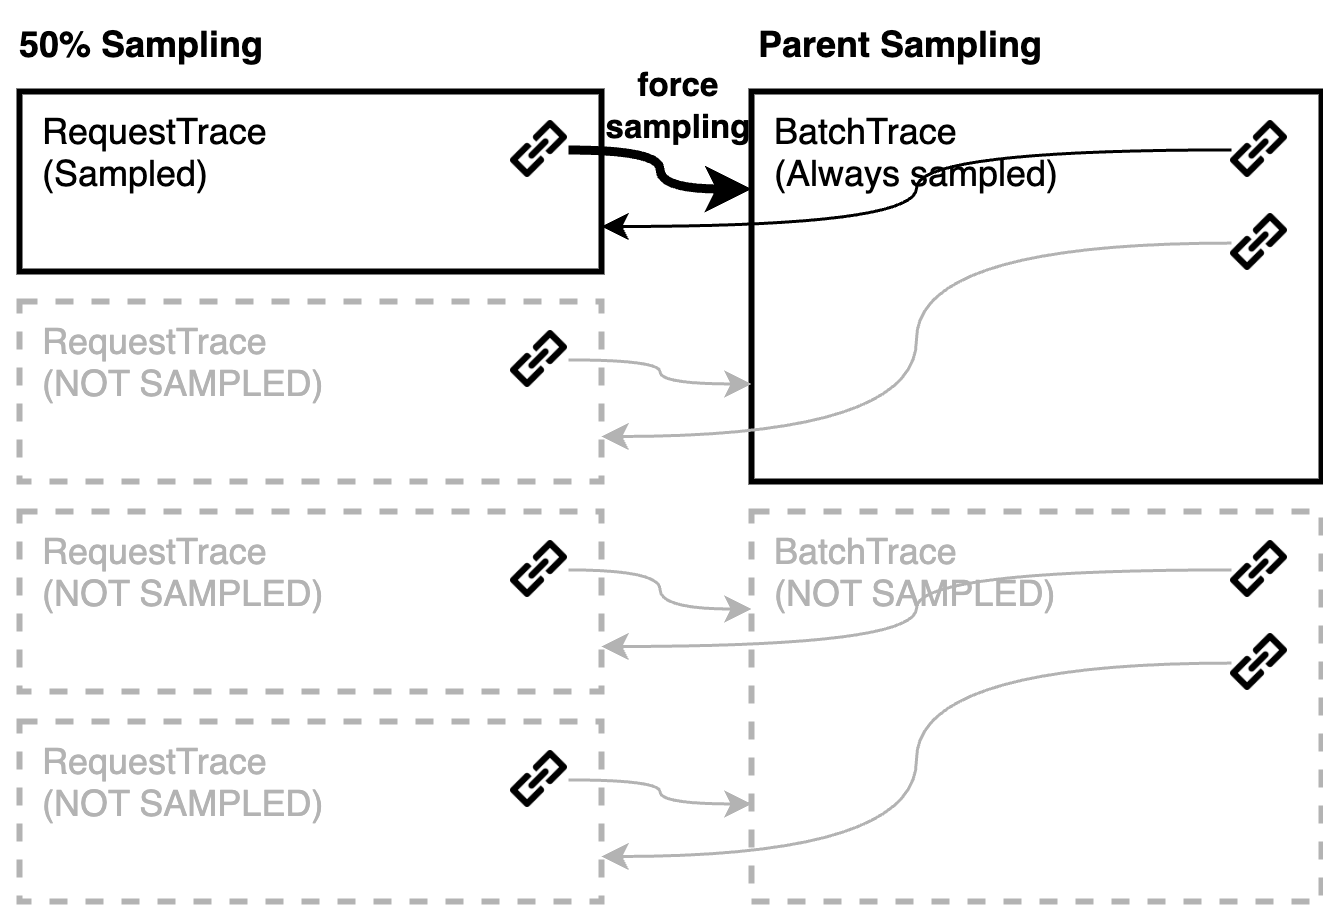
After: correlated sampling
Juggling Multiple Traces
One more problem is that the PFP API server handles multiple requests in a batch, and the GPU calculation acts on the batch estimation, meaning that the batch cannot be deconstructed.
If we look into the implementation of OpenTelemetry for Python and JavaScript, we notice that the ContextVarsRuntimeContext and AsyncLocalStorageContextManager are used respectively. This means that if we call multiple async functions, we are able to use separate contexts in each function, making it possible to leverage the context mechanism implemented in the library.
However, in our case, the requests are handled in a single thread and the GPU calculation is for all requests, making it impossible to do so. It is difficult to handle multiple traces simultaneously in a single thread.
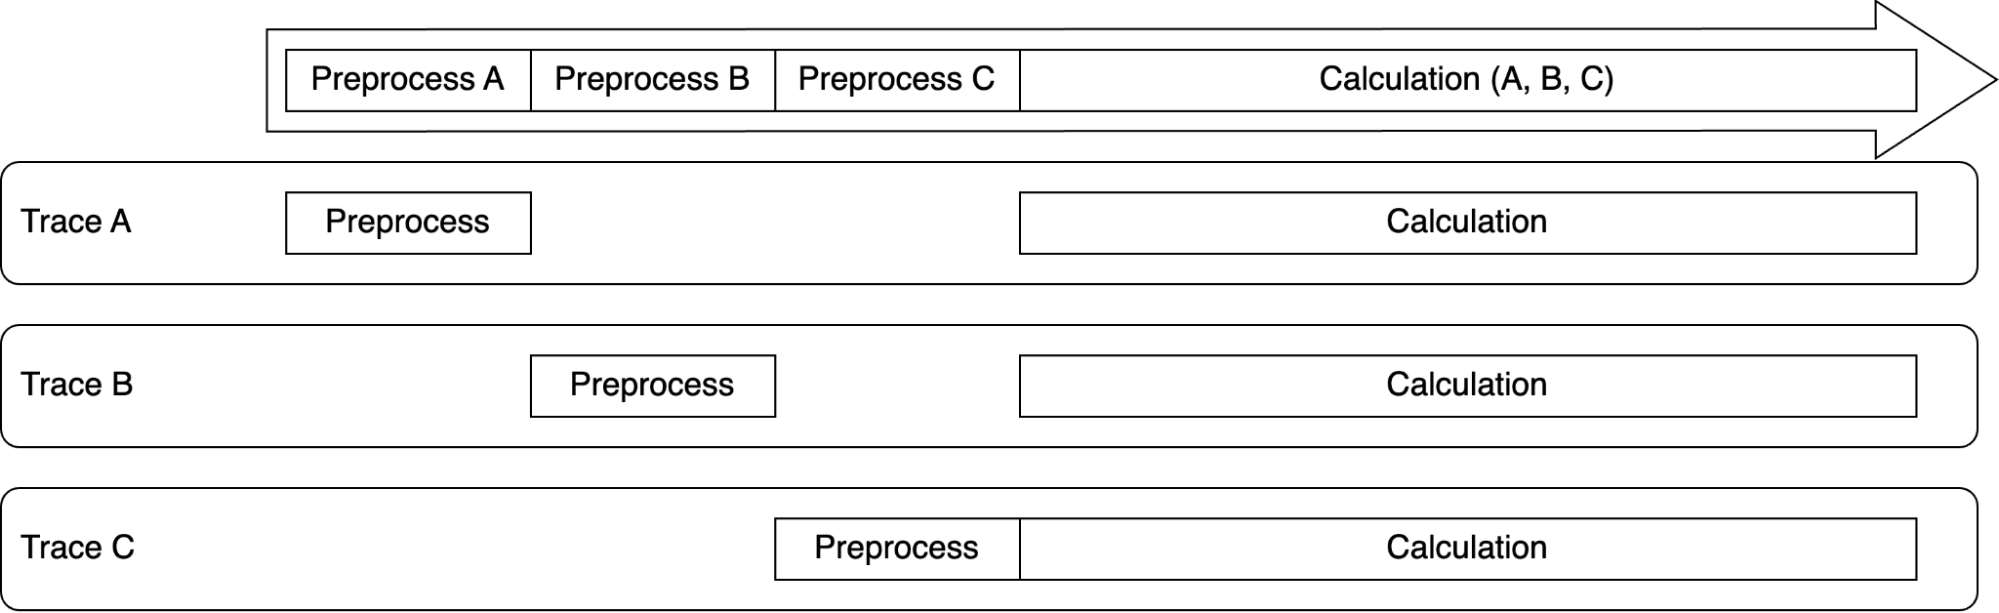
Schematic view of PFP calculation
Since we want to have a single trace for each request which spans across the API gateway, the consumer and the API server, we will need to handle the contexts by ourselves, since instrumentation libraries expect a single OpenTelemetry context per thread. In order to add traces to a specific request, we will need to specify the context each time we create a span. In addition, we will need to overwrite and restore the context when we enter and exit the span respectively. By writing some helper code, we are able to instrument the library.
Performance
Since Matlantis runs on machines with GPUs attached, even a small decrease in performance will lead to a non-negligible increase in infrastructure cost. Therefore, we need to be careful when adding instrumentation to the applications, so as to minimize the overhead. For instance, usually spans are always created, while only sampled spans are sent. However, in our case, we have to modify the instrumentation code to only create spans when we know that the trace is sampled. This does not work for all applications, but in our case it does. As a result, we are able to enable visibility into the system with only minimal overhead.
On a side note, continuous profiling with Pyroscope is introduced in order to measure the overhead of the tracing code more accurately. Pyroscope is easy to introduce and provides useful insight into how much time is spent in total for each function, with only a small overhead. Surprisingly, in the process, we discovered an unknown regression unrelated to OpenTelemetry with Pyroscope. Pyroscope has proven to be a useful tool, and it is likely that we will continue to use it in the future.
Summary
OpenTelemetry is a powerful framework for distributed tracing, although a few tricks are required in the case of batch workloads. Using OpenTelemetry, we were able to successfully identify several bottlenecks and remove them by optimization.
